








Quick Verdict
Daktronics reported first-quarter fiscal 2027 diluted EPS of $0.40, up 21.2% year over year, on revenue of $234.6 million, up 7.1%. Sales came modestly below one reported consensus estimate, but gross-margin expansion, strong cash generation, and a $311 million backlog supported a positive after-hours/premarket reaction.
About Daktronics
Daktronics, Inc. (NASDAQ: DAKT) is a Brookings, South Dakota-based designer, manufacturer, marketer, and servicer of large-format digital display systems. The company was founded in 1968 and is known for LED video displays, electronic scoreboards, digital billboards, transportation signage, and the control systems that power real-time graphics, video, animation, and information displays. Its core operating markets include Live Events, Commercial, High School, Park and Recreation, Transportation, and International.
The company reported a quarter-end cash balance of $154.6 million, total debt of approximately $10.5 million, and a current ratio of 2.2x as of August 1, 2026. Daktronics generated $19.4 million in quarterly net income and repurchased $4.4 million of common stock during the period. A current market capitalization, P/E ratio, and dividend yield are not included in the company’s earnings release and should be sourced from a real-time market-data provider before publication. Daktronics did not report a quarterly dividend in the release.
Top Financial Highlights
- Total net sales increased 7.1% year over year to $234.6 million, despite Q1 FY2027 having 13 weeks versus 14 weeks in Q1 FY2026.
- Net income rose 18.0% to $19.4 million, compared with $16.5 million in the prior-year quarter.
- Diluted EPS increased 21.2% to $0.40, from $0.33, representing the company’s highest quarterly diluted EPS in the past 12 quarters.
- Gross profit increased to $71.6 million from $65.1 million.
- Gross margin expanded 80 basis points to 30.5%, aided by favorable product mix, operating leverage, and tariff refunds; higher memory and other price-sensitive input costs partly offset these benefits.
- Operating income increased 7.2% to $24.9 million, while operating margin was unchanged at 10.6%.
- Operating expenses increased to $46.7 million, from $41.8 million, reflecting international-project commissions, consulting for operational initiatives, and XDC/microLED development activity.
- Operating cash flow totaled $31.4 million, up from $26.1 million a year earlier.
- Free cash flow was $27.5 million, calculated after $4.1 million in property-and-equipment spending.
- Quarter-end cash and cash equivalents were $154.6 million; total current and long-term debt was approximately $10.5 million.
- Live Events revenue rose 8.3% to $86.4 million, maintaining its position as Daktronics’ largest business unit by sales.
- International revenue increased 66.1% to $28.4 million, the fastest growth rate among reported operating units.
- Transportation revenue climbed 29.0% to $21.4 million, supported by demand in intelligent transportation systems and airport-related projects.
- Commercial revenue declined 5.3% to $43.7 million, while High School Park and Recreation revenue fell 7.8% to $54.7 million.
- New orders declined 19.6% to $191.8 million, although management said several substantial transactions negotiated in Q1 are expected to convert into booked orders in Q2.
- Product backlog ended at $311.3 million, the sixth straight quarter in which backlog exceeded $300 million.
- Management reiterated its fiscal 2028 targets: 7%–10% revenue CAGR, 10%–12% operating margin, and 17%–20% ROIC. It did not issue specific Q2 FY2027 sales or EPS guidance.
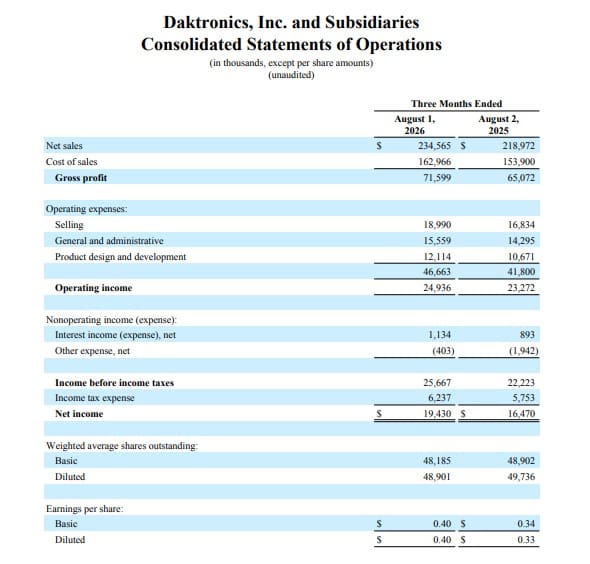
Daktronics, Inc. and Subsidiaries Consolidated Statements of Operations
(Source: investor.daktronics.com)
- The table presents Daktronics, Inc. and Subsidiaries’ unaudited Consolidated Statements of Operations for the three months ended August 1, 2026, compared with the three months ended August 2, 2025. Financial figures are reported in USD thousands, except for per-share amounts.
- Daktronics reported net sales of USD 234.565 million in the 2026 quarter, up from USD 218.972 million in the corresponding 2025 period. Gross profit increased to USD 71.599 million from USD 65.072 million, while cost of sales rose to USD 162.966 million.
- Total operating expenses increased to USD 46.663 million from USD 41.800 million. These expenses included USD 18.990 million in selling expenses, USD 15.559 million in general and administrative expenses, and USD 12.114 million in product design and development spending. Despite higher expenses, operating income improved to USD 24.936 million, compared with USD 23.272 million a year earlier.
- Income before income taxes reached USD 25.667 million, while net income increased to USD 19.430 million from USD 16.470 million in the prior-year quarter. The improvement was also supported by higher interest income and lower other net expenses.
- Earnings per share strengthened during the period. Basic EPS increased to USD 0.40 from USD 0.34, while diluted EPS rose to USD 0.40 from USD 0.33. Overall, the table indicates improved sales, gross profit, operating income, and net profitability for Daktronics during the quarter ended August 1, 2026
Beat or Miss?
Daktronics’ reported results should be described carefully because third-party earnings sources showed differing consensus figures. The Investing.com coverage cited revenue expectations of $236.47 million and characterized the result as a modest revenue miss; it also described EPS as marginally below its cited forecast. The company itself did not provide analyst-consensus figures in its official release.
| Metric | Reported | Difference/Analysis |
| Revenue | $234.6 million | Approximately 0.8% below the $236.47 million consensus estimate cited by Investing.com |
| Diluted EPS | $0.40 | Investing.com described EPS as slightly below its cited forecast; the company did not disclose the consensus figure |
| Net income | $19.4 million | Up 18.0% year over year; no consensus comparison disclosed |
| Gross margin | 30.50% | Up 80 basis points year over year, supporting the stronger bottom-line performance |
| Operating income | $24.9 million | Up 7.2% year over year, with operating margin maintained at 10.6% |
| Product backlog | $311.3 million | Down from $360.3 million a year earlier, but remained above $300 million for the sixth consecutive quarter |
| Q2 FY2027 guidance | N/A | No formal next-quarter revenue or EPS outlook was provided; management expects certain Q1-negotiated orders to book in Q2 |
The key earnings takeaway is that investors appeared to prioritize profitability and liquidity over the small top-line variance. Margin improvement, higher operating cash flow, low debt, and an above-$300 million backlog helped offset the weaker order-booking comparison.
What Leadership Is Saying
“Fiscal 2027 began on a strong note as we continued to drive momentum in sales, operating income, and EPS, maintaining our focus on executing the growth and operational excellence initiatives laid out in our long-term plan.”
— Ramesh Jayaraman, President and Chief Executive Officer
“Supported by the execution of our strategic initiatives, our pipeline remains robust. At the same time, our operational improvements are making us leaner and smarter every quarter.”
— Ramesh Jayaraman, President and Chief Executive Officer
“Top line growth was solid again this quarter, with net sales increasing 7.1 percent compared to the first quarter of fiscal 2026, despite one less week this quarter.”
— Howard Atkins, Acting Chief Financial Officer
“Gross profit rose to $71.6 million or 30.5 percent gross profit margin in the first quarter of fiscal 2027, compared with 29.7 percent gross profit margin a year earlier.”
— Howard Atkins, Acting Chief Financial Officer
Historical Performance
| Category | Q1 FY2027 | Q1 FY2026 | Change (%) |
| Revenue / Net sales | $234.6 million | $219.0 million | 7.10% |
| Gross profit | $71.6 million | $65.1 million | 10.00% |
| Gross margin | 30.50% | 29.70% | +80 bps |
| Operating expenses | $46.7 million | $41.8 million | 11.60% |
| Operating income | $24.9 million | $23.3 million | 7.20% |
| Net income | $19.4 million | $16.5 million | 18.00% |
| Diluted EPS | $0.40 | $0.33 | 21.20% |
| Operating cash flow | $31.4 million | $26.1 million | 20.40% |
| Free cash flow | $27.5 million | $22.0 million | 25.00% |
| New orders | $191.8 million | $238.5 million | -19.60% |
| Product backlog | $311.3 million | $360.3 million | -13.60% |
The comparison is notable because the FY2027 quarter included one fewer operating week than the year-earlier period. Revenue, operating income, net income, EPS, gross profit, operating cash flow, and free cash flow all grew despite the shorter reporting period. However, the 19.6% decline in new orders and 13.6% lower backlog remain areas to monitor, especially if the anticipated Q2 order conversions do not materialize.
Competitor Comparison
A direct “Q1 current versus Q1 prior-year” competitor table cannot be prepared reliably from Daktronics’ earnings materials alone because competitors operate on different fiscal calendars, report at different times, and do not provide a standardized, directly comparable business-unit breakdown in Daktronics’ release. Publishing numerical competitor comparisons without separately validating each company’s latest filing would risk misleading readers.
| Category | Daktronics Q1 FY2027 | Daktronics Q1 FY2026 | Change (%) |
| Revenue | $234.6 million | $219.0 million | 7.10% |
| Net income | $19.4 million | $16.5 million | 18.00% |
| Operating expenses | $46.7 million | $41.8 million | 11.60% |
| Gross margin | 30.50% | 29.70% | +80 bps |
| Operating cash flow | $31.4 million | $26.1 million | 20.40% |
For a competitor-specific extension, the most relevant comparison set would generally include companies in LED display systems, digital out-of-home displays, sports-venue technology, and transportation-information displays. The comparison should normalize revenue exposure, fiscal periods, currency, geographic mix, and hardware-versus-software revenue mix before concluding.
How the Market Reacted?
Daktronics shares rose following the September 2 release as investors responded positively to gross-margin improvement, cash flow, and sustained backlog. Investing.com reported a 6.95% gain to $20.705 following the announcement, while another report cited a 9.71% rise to $21.24 in premarket trading; the difference likely reflects different timestamps and trading sessions. The reaction indicates that the market viewed the slight revenue shortfall as less important than the 21.2% EPS growth, 30.5% gross margin, $31.4 million of operating cash flow, and $311.3 million backlog.



