








Quick Verdict
Zoomd Technologies reported Q2 2026 EPS of C$0.02, revenue of US$7.7 million, and net income of US$1.2 million. In this article, we’ll take a closer look at the Zoomd Technologies Q2 2026 Earnings and what the results could mean for investors. Revenue fell sharply year over year and missed the reported US$10.6 million analyst forecast, but sequential profitability improved. Shares were reported up about 6% in pre-market trading after the release.
About Zoomd Technologies
Zoomd Technologies Ltd. is a Toronto-based marketing-technology company trading on the TSX Venture Exchange as TSXV: ZOMD and over the counter in the United States as OTC: ZMDTF. Established in 2012 and publicly listed on the TSX Venture Exchange since September 2019, Zoomd operates a mobile-focused user-acquisition and engagement platform for advertisers. Its platform integrates multiple global digital-media sources into a single campaign-management environment, intended to simplify media buying, improve data visibility, and reduce the operational burden of managing separate advertising channels.
As of the latest available market data around the earnings release, Zoomd’s market capitalization was approximately C$50 million (about US$36.3 million), while its reported June 30 cash position of US$22.6 million implies a relatively modest enterprise value. One market-data analysis estimated a trailing valuation of about 7.6x annualized earnings based on Q2 profitability; this should be treated as an indicative calculation rather than company guidance. Zoomd does not report a dividend yield in the earnings release.
Top Financial Highlights
- Q2 2026 revenue was US$7.7 million, down 61% year over year from US$19.6 million in Q2 2025.
- Revenue improved by more than 10% sequentially from Q1 2026, reflecting higher activity levels, including improvement at one major customer.
- Net income was US$1.2 million, compared with US$6.1 million in Q2 2025.
- EPS was C$0.02 for Q2 2026.
- Gross margin held at 43%, unchanged from the prior-year quarter.
- Total operating expenses were US$2.8 million, down 7% year over year as the company continued efficiency and cost-optimization efforts.
- Operating expenses also declined approximately 4% quarter over quarter, according to earnings coverage.
- EBITDA was US$0.7 million, versus US$5.5 million in Q2 2025.
- EBITDA improved by roughly US$1 million from Q1 2026, aided by higher revenue and a leaner cost base.
- Operating income was reported at approximately US$450,000, marking a return to positive operating profitability following a Q1 loss.
- Zoomd ended June 30, 2026 with US$22.6 million in cash and no bank debt.
- During the quarter, the company repurchased and cancelled 131,000 common shares under its normal course issuer bid (NCIB).
- The reported US$7.7 million of revenue consisted of the company’s consolidated MarTech user-acquisition and engagement-platform activity; the release did not disclose revenue by individual product line, geography, or customer.
Quarterly Performance Highlights
(Source: in.investing.com)
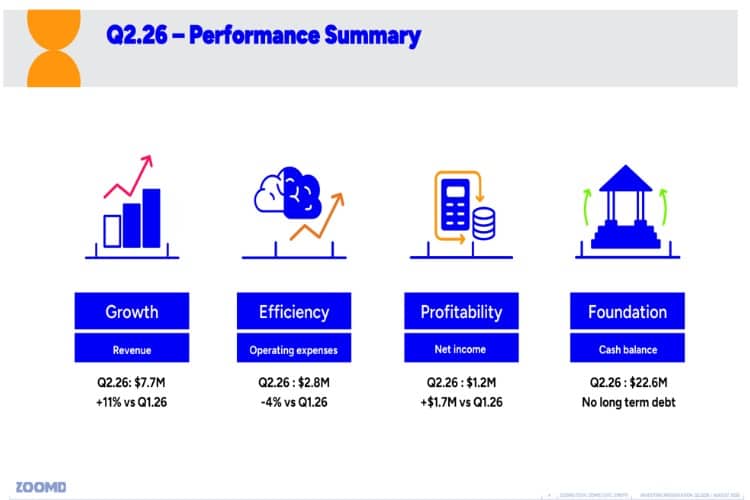
The image presents Zoomd’s Q2 2026 performance summary, highlighting improvements across four key business areas: growth, efficiency, profitability, and financial foundation.
- Growth: Revenue reached $7.7 million in Q2 2026, representing an increase of 11% compared with Q1 2026.
- Efficiency: Operating expenses declined to $2.8 million, down 4% from Q1 2026, indicating improved cost management.
- Profitability: Net income stood at $1.2 million, improving by $1.7 million compared with Q1 2026.
- Foundation: The company reported a strong cash balance of $22.6 million and maintained no long-term debt.
Overall, the results indicate revenue growth, lower operating costs, improved profitability, and a strong balance sheet position during Q2 2026.
Beat or Miss?
| Metric | Reported | Difference/Analysis |
| Revenue | US$7.7 million | Reportedly missed the US$10.6 million analyst forecast by US$2.9 million, or about 27.4%. |
| EPS | C$0.02 | No reliable consensus EPS estimate was disclosed in the company’s release or the available market coverage. |
| Net income | US$1.2 million | Returned sharply from a reported Q1 2026 net loss of roughly US$466,000, but remained below Q2 2025 net income of US$6.1 million. |
| Gross margin | 43% | Stable year over year, indicating that core unit economics held despite lower revenue and changes in customer mix. |
| EBITDA | US$0.7 million | Positive and approximately US$1 million better than Q1 2026, though down from US$5.5 million in Q2 2025. |
| Cash balance | US$22.6 million | A major balance-sheet positive, especially because the company had no bank debt at quarter-end. |
| Q3/full-year guidance | Not provided | Management gave strategic commentary but did not publish quantitative outlook targets. |
What Leadership Is Saying
“This quarter reflects a clear improvement in our operating performance, with revenues increasing by 11% compared with Q1.2026, supported by positive operating income and EBITDA.” — Ido Almany, Chief Executive Officer, Zoomd Technologies
“With over $22 million in cash, capital is our strongest card, and alongside our proven marketing and AI capabilities, it lets us pursue opportunities that would materially change the scale of this business.” — Ido Almany, Chief Executive Officer, Zoomd Technologies
Historical Performance
| Category | Q2 2026 | Q2 2025 | Change (%) |
| Revenue | US$7.7 million | US$19.6 million | -61% |
| Net income | US$1.2 million | US$6.1 million | -80% |
| EBITDA | US$0.7 million | US$5.5 million | -87% |
| Gross margin | 43% | 43% | 0% |
| Operating expenses | US$2.8 million | Not stated in the release | -7% |
The central year-over-year issue was the decline in revenue following operating-model changes at two major customers. However, the unchanged gross margin and reduction in operating expenses suggest Zoomd preserved underlying margin discipline while resetting its cost base to a smaller revenue scale.
For the first half of 2026, revenue was US$14.6 million, compared with US$37.74 million in the first half of 2025, while net income was US$0.754 million, compared with US$10.84 million a year earlier.
Competitor Comparison
A direct, like-for-like competitor comparison is not available from Zoomd’s Q2 release because it contains no peer financial table and does not identify a defined comparable-company set. Mobile performance marketing, ad-tech, and app-acquisition companies also frequently differ materially by customer mix, geographic exposure, business model, and accounting presentation.
| Category | Zoomd Q2 2026 | Zoomd Q2 2025 | Change (%) |
| Revenue | US$7.7 million | US$19.6 million | -61% |
| Net income | US$1.2 million | US$6.1 million | -80% |
| Operating expenses | US$2.8 million | Not separately disclosed | -7% |
For an apples-to-apples peer comparison, the most useful benchmarks would be smaller public mobile-advertising, ad-tech, or performance-marketing companies with reported gross margin, EBITDA, customer-concentration disclosure, and cash balances. The present release does not provide enough peer data to responsibly populate such a table.
How the Market Reacted?
Initial reaction was positive despite the revenue shortfall. Earnings coverage reported that shares rose approximately 6% to US$0.53 in premarket trading, with investors emphasizing the return to positive operating income and EBITDA, the sequential improvement in net income, and the company’s US$22.6 million cash balance with no bank debt.
However, end-of-day market data on August 31 was more muted and inconsistent across venues: one source showed TSXV-listed ZOMD at C$0.49, down 2.0% for the session, while another showed C$0.51, up 2.0%. This discrepancy likely reflects differing timestamps or market-data feeds, so the clearest conclusion is that the immediate reaction was volatile rather than uniformly bullish.
The report’s fundamental sentiment is cautiously constructive: Zoomd’s revenue base remains materially lower than a year ago, and customer concentration continues to pressure growth, but positive sequential momentum, cost discipline, stable gross margin, buybacks, and a cash-rich, debt-free balance sheet provide operational flexibility.



