








Quick Verdict
Ollie’s Bargain Outlet reported second-quarter fiscal 2026 diluted EPS of $1.42, beating the $1.14 consensus estimate, while revenue of $741.3 million rose 9.1% year over year but missed the $752.9 million estimate. Shares initially rose in premarket trading as investors welcomed sharply higher margins and improved full-year profit guidance.
About Ollie’s Bargain Outlet
Ollie’s Bargain Outlet Holdings, Inc. (NASDAQ: OLLI) is a U.S. off-price retailer of brand-name household merchandise, including closeout and excess inventory sourced from suppliers and manufacturers. Founded in 1982 and headquartered in Harrisburg, Pennsylvania, the company operates under its “Good Stuff Cheap” value proposition, offering a rotating, treasure-hunt-style merchandise assortment at discounts of up to 70% below traditional retailers.
As of August 1, 2026, Ollie’s operated 686 stores across 36 states, up 11.9% from 613 stores a year earlier. Its Ollie’s Army loyalty program reached 18.1 million members, a 12.7% increase year over year. The company’s Q2 results underscore a mixed retail environment: rapid unit expansion and tariff-related margin benefits drove profit growth, but comparable-store sales declined amid weak consumer demand, unfavorable weather, and elevated promotional activity.
Ollie’s reported $507.1 million in total cash and investments at quarter-end and only $1.4 million in long-term debt, giving it substantial balance-sheet flexibility for store expansion, pricing investments, capital expenditures, and share repurchases.
Top Financial Highlights
- Net sales increased 9.1% year over year to $741.3 million, mainly driven by new store growth.
- GAAP net income rose 39.4% to $85.5 million, from $61.3 million in the prior-year quarter.
- Diluted EPS increased 43.4% to $1.42, versus $0.99 in Q2 fiscal 2025.
- Adjusted diluted EPS was also $1.42, up 43.4% year over year.
- Gross profit climbed to $322.2 million, from $271.3 million a year earlier.
- Gross margin expanded 360 basis points to 43.5%, compared with 39.9% in Q2 fiscal 2025.
- IEEPA tariff refunds added 380 basis points to second-quarter gross margin; the company received $28.3 million in refunds and plans to reinvest a portion into pricing.
- Comparable-store sales declined 1.8%, against 5.0% comparable-store growth in the same period last year.
- Selling, general and administrative expenses rose to 26.6% of sales, versus 25.8% a year earlier, largely due to fixed-cost deleverage and higher marketing spending.
- Operating income increased 40.9% to $108.5 million, lifting operating margin to 14.6% from 11.3%.
- Adjusted EBITDA advanced 35.5% to $127.1 million, while adjusted EBITDA margin improved to 17.1% from 13.8%.
- Operating cash flow increased to $108.1 million, compared with $80.7 million in the prior-year quarter.
- The company opened 15 stores and closed one storm-damaged location, ending Q2 with 686 stores.
- Total cash and investments reached $507.1 million, comprising $120.8 million in cash, $66.7 million in short-term investments, and $319.6 million in long-term investments.
- Ollie’s repurchased 1.107 million shares for $84.0 million during Q2; $121.5 million remained available under the existing repurchase authorization.
- Fiscal 2026 net-sales guidance was lowered to $2.928 billion to $2.941 billion, from the prior range of $2.980 billion to $3.000 billion.
- Fiscal 2026 adjusted EPS guidance was raised to $4.57 to $4.65, from $4.45 to $4.55 previously.
Note on segment revenue: Ollie’s operates principally as a single retail business and does not report separate operating-segment revenue in its earnings release. The most relevant operating drivers are total net sales, comparable-store sales, store count, and store openings.
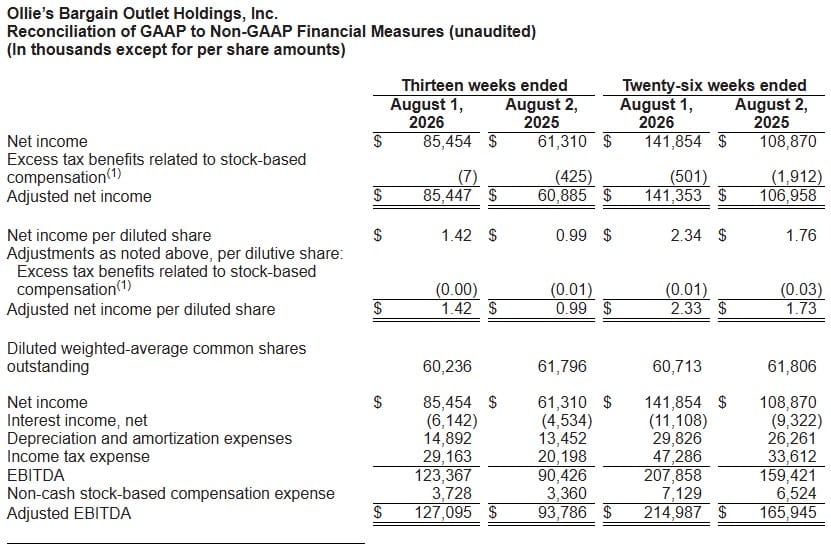
Ollie’s Bargain Outlet Holdings, Inc. Reconciliation of GAAP to Non-GAAP Financial Measures
(Source: investors.ollies.com )
- The table presents Ollie’s Bargain Outlet Holdings, Inc.’s reconciliation of GAAP to non-GAAP financial measures, covering the thirteen weeks and twenty-six weeks ended August 1, 2026, compared with the corresponding periods ended August 2, 2025. Figures are reported in USD thousands, except for per-share amounts.
- For the thirteen weeks, net income increased to USD 85.454 million in 2026 from USD 61.310 million in 2025. Adjusted net income reached USD 85.447 million, compared with USD 60.885 million in the prior-year period. Diluted net income per share increased to USD 1.42 from USD 0.99, while adjusted diluted EPS also stood at USD 1.42.
- For the twenty-six-week period, net income rose to USD 141.854 million, compared with USD 108.870 million in 2025. Adjusted net income increased to USD 141.353 million from USD 106.958 million. Diluted EPS improved to USD 2.34 from USD 1.76, while adjusted diluted EPS increased to USD 2.33 from USD 1.73.
- The table also shows a strong increase in operating profitability. EBITDA reached USD 123.367 million for the thirteen weeks, up from USD 90.426 million, while adjusted EBITDA increased to USD 127.095 million from USD 93.786 million. For the twenty-six-week period, adjusted EBITDA rose to USD 214.987 million, compared with USD 165.945 million a year earlier.
- Overall, the figures indicate strong year-over-year growth in net income, earnings per share, EBITDA, and adjusted EBITDA, reflecting improved profitability during the first half of fiscal 2026.
Beat or Miss?
Ollie’s delivered a substantial earnings-per-share beat, but its revenue fell below consensus as negative comparable-store sales offset part of the contribution from new locations. The company also missed the analyst expectation for comparable-store sales, which had called for modest growth.
| Metric | Reported | Difference/Analysis |
| Net sales | $741.3 million | Missed Zacks consensus of $752.9 million by $11.6 million, or 1.54%. |
| Diluted EPS | $1.42 | Beat consensus of $1.14 by $0.28, a 24.56% positive surprise. |
| Comparable-store sales growth | -1.80% | Below the average analyst estimate of +0.3%. |
| Store openings | 15 | In line with the three-analyst average estimate of 15. |
| Stores at period-end | 686 | Slightly below the average estimate of 687. |
| Gross margin | 43.50% | Up 360 basis points year over year, aided materially by tariff refunds and lower tariff rates. |
| Adjusted EBITDA | $127.1 million | Up 35.5% year over year; margin rose to 17.1% from 13.8%. |
| FY2026 adjusted EPS guidance | $4.57–$4.65 | Raised from $4.45–$4.55, despite a lower sales outlook. |
| FY2026 net-sales guidance | $2.928–$2.941 billion | Reduced from $2.980–$3.000 billion to reflect recent sales trends and current conditions. |
What Leadership Is Saying
CEO Eric van der Valk attributed the comparable-sales decline to a difficult consumer and promotional environment, while emphasizing that disruption in retail supply channels can create more closeout buying opportunities for Ollie’s.
“We delivered strong earnings growth in the second quarter and continued to execute against our key strategic initiatives. Comparable store sales declined 1.8% against a challenging multi-year stack. We believe our sales results were negatively impacted by the combination of less favorable weather, continued economic pressure on the consumer, and an elevated promotional environment.” — Eric van der Valk, President and Chief Executive Officer.
“Consumers continue to seek value and many of the same pressures affecting our customers are creating buying opportunities across the closeout market. We continue to see strong deal flow and remain committed to reinvesting in price and strengthening our competitive position.” — Eric van der Valk, President and Chief Executive Officer.
Historical Performance
| Category | Q2 Fiscal 2026 | Q2 Fiscal 2025 | Change (%) |
| Revenue / net sales | $741.3 million | $679.6 million | 9.10% |
| Gross profit | $322.2 million | $271.3 million | 18.70% |
| Gross margin | 43.50% | 39.90% | +360 bps |
| Operating income | $108.5 million | $77.0 million | 40.90% |
| Operating margin | 14.60% | 11.30% | +330 bps |
| Net income | $85.5 million | $61.3 million | 39.40% |
| Diluted EPS | $1.42 | $0.99 | 43.40% |
| SG&A expense | $197.2 million | $175.5 million | 12.40% |
| SG&A as % of sales | 26.60% | 25.80% | +80 bps |
| Adjusted EBITDA | $127.1 million | $93.8 million | 35.50% |
| Operating cash flow | $108.1 million | $80.7 million | 33.90% |
| Stores at quarter-end | 686 | 613 | 11.90% |
Source data from Ollie’s Q2 fiscal 2026 earnings release for the 13 weeks ended August 1, 2026, compared with the 13 weeks ended August 2, 2025.
Competitor Performance
Because Ollie’s is a single-segment retailer, a competitor comparison is more useful when focused on the off-price retail peer group. The available contemporaneous coverage indicates that Ross Stores reported 13.3% revenue growth and results above expectations, while Burlington Stores reported results below expectations. However, the cited reporting does not provide a complete, directly comparable quarterly revenue, net income, and operating-expense dataset for both peers; therefore, figures should not be inferred.
| Category | Ollie’s Q2 Fiscal 2026 | Peer Read-Through | Analysis |
| Revenue growth | +9.1% to $741.3 million | Ross Stores: +13.3% revenue growth | Ollie’s store expansion drove sales growth, but its pace trailed the reported Ross growth rate. |
| Comparable-store sales | -1.80% | N/A in available peer coverage | Ollie’s faced traffic/basket pressure, adverse weather, consumer strain, and elevated promotions. |
| Earnings versus estimates | EPS beat by 24.56% | Ross: above estimates; Burlington: below expectations | Ollie’s joined Ross in surpassing earnings expectations, but its sales miss differentiates its report. |
| Margin trend | Gross margin +360 bps to 43.5% | N/A in available peer coverage | Ollie’s profit growth was materially supported by IEEPA tariff refunds rather than solely by organic same-store sales performance. |
| Store expansion | 15 openings; 686 stores at quarter-end | N/A in available peer coverage | Unit expansion remains central to Ollie’s revenue-growth strategy. |
How the Market Reacted?
Initial market reaction was favorable, reflecting the EPS beat, 360-basis-point gross-margin expansion, increased full-year adjusted EPS outlook, and accelerated share repurchases. Yahoo Finance’s early report stated that Ollie’s shares rose 2.3% in premarket trading following the release.
Subsequent market coverage showed a stronger intraday reaction, with one report citing a 4.2% afternoon gain and another citing a 6.55% premarket increase, illustrating that the exact percentage varied by observation time. Investors appeared to prioritize stronger profitability and capital returns over the softer sales backdrop, though the reduced full-year sales target and 1.8% comparable-store-sales decline remain the principal watch items for future quarters.



