








Quick Verdict
Kestra Medical Technologies Q1 Fiscal 2027 Earnings results showed a GAAP loss per share of $0.75 and revenue of $31.0 million. Revenue exceeded one published pre-earnings estimate, while EPS missed consensus estimates. After-hours trading initially fell, although KMTS subsequently gained during the next regular session amid heavy volume.
About Kestra Medical Technologies
Kestra Medical Technologies, Ltd. (Nasdaq: KMTS) is a Kirkland, Washington-based wearable medical-device and digital-healthcare company. Founded in 2014, it develops connected cardiac monitoring and therapeutic-intervention technologies, including its wearable cardioverter defibrillator platform, to protect patients at risk of sudden cardiac arrest. The company’s commercial focus is expanding adoption, improving reimbursement and revenue-cycle execution, and adding sales territories in the wearable cardioverter defibrillator market.
As of the earnings-report period, KMTS had an indicated market capitalization of roughly $1.48 billion–$1.49 billion. The company remains loss-making, so a meaningful P/E ratio is not available. Public company-profile data list approximately 443 full-time employees, while its FY2025 SEC filing reported more than 330 employees as of April 30, 2025, indicating significant organizational expansion. Kestra does not currently pay a dividend.
Top Financial Highlights
- Total revenue was $31.0 million, up 60.0% year over year from $19.4 million.
- Revenue surpassed a published pre-results estimate of roughly $29.6 million by approximately $1.4 million, or 4.7%.
- Gross profit nearly doubled to $17.5 million, from $8.9 million a year earlier.
- Gross margin expanded by 10.8 percentage points to 56.5%, from 45.7%.
- GAAP net loss widened to $44.1 million, compared with a $25.8 million loss in the prior-year quarter.
- GAAP loss per share was $0.75, versus a $0.50 loss per share in fiscal Q1 2026.
- GAAP operating expenses rose 46.2% to $55.2 million, from $37.7 million.
- Research and development expense increased to $6.8 million, from $4.0 million.
- Selling, general and administrative expense increased to $48.4 million, from $33.7 million.
- Adjusted operating expenses were $44.2 million, compared with $30.3 million in the prior-year period.
- Adjusted EBITDA loss was $24.0 million, compared with a $19.4 million adjusted EBITDA loss a year earlier.
- Net cash used in operating activities was $32.3 million, compared with $26.3 million in the prior-year quarter.
- Cash, cash equivalents and investments totaled $244.7 million at July 31, 2026; including undrawn committed term-loan availability, total liquidity was about $320 million.
- Kestra raised FY2027 revenue guidance to $141.0 million, from prior guidance of $137.0 million; the new outlook implies 48% growth versus FY2026.
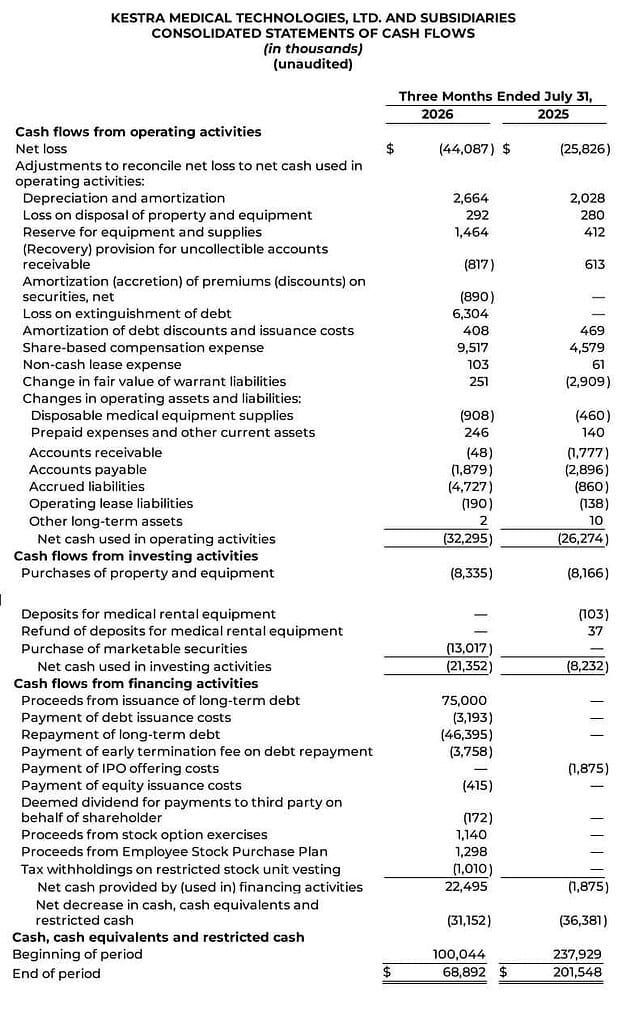
Kestra Medical Technologies, Ltd. And Subsidiaries Consolidated Statements Of Cash Flows
(Source: globenewswire.com)
- The table presents Kestra Medical Technologies, Ltd. and Subsidiaries’ consolidated cash flows for the three months ended July 31, 2026, compared with the same period in 2025. All figures are reported in USD thousands.
- The company reported a larger net loss of USD 44.1 million in 2026, compared with USD 25.8 million in 2025. Several non-cash items partially offset this loss, including USD 9.5 million in share-based compensation, USD 6.3 million from loss on extinguishment of debt, and USD 2.7 million in depreciation and amortization. As a result, net cash used in operating activities was USD 32.3 million, compared with USD 26.3 million a year earlier.
- Investing cash outflows also increased. Net cash used in investing activities reached USD 21.4 million in 2026, up from USD 8.2 million in 2025. This included USD 8.3 million in purchases of property and equipment and USD 13.0 million in purchases of marketable securities.
- Financing activities were the main source of cash during the quarter. Kestra generated USD 22.5 million in net financing cash in 2026, compared with a USD 1.9 million outflow in 2025. The company received USD 75.0 million from long-term debt issuance, although this was partly offset by USD 46.4 million in debt repayments, USD 3.8 million in early termination fees, and USD 3.2 million in debt issuance costs.
- Overall, cash, cash equivalents, and restricted cash declined by USD 31.2 million during 2026, compared with a decrease of USD 36.4 million in the prior-year period. The company ended the quarter with USD 68.9 million in cash, cash equivalents, and restricted cash, down from USD 100.0 million at the beginning of the period.
- Overall, the table shows higher operating and investing cash outflows in 2026, while substantial debt financing helped partially offset these uses of cash and limited the overall decline in liquidity.
Beat or Miss?globenewswire.com
| Metric | Reported | Difference/Analysis |
| Revenue | $30.97 million | Above a published pre-earnings estimate of $29.59 million by about $1.38 million, or 4.7%. |
| GAAP EPS | -$0.75 | Missed the published consensus estimate of -$0.61 by $0.14 per share. |
| Alternative published EPS expectation | -$0.75 | Another source cited a -$0.45 forecast, implying a $0.30 shortfall; estimates therefore varied by data provider. |
| FY2027 revenue guidance | $141.0 million | Raised from $137.0 million and above the cited $137.1 million consensus estimate. |
| Gross margin | 56.50% | Improved 10.8 percentage points year over year; no consensus gross-margin forecast was identified. |
| Adjusted EBITDA | -$24.0 million | Wider than the -$19.4 million loss in the prior-year period; consensus not reported in the release. |
The central earnings takeaway is mixed: top-line execution and FY2027 guidance were stronger, but profitability metrics remained pressured by commercial expansion, R&D investment, stock-based compensation, and a $6.3 million loss on extinguishment of debt. The EPS comparison should be treated carefully because third-party providers reported different consensus figures.
What Leadership Is Saying
“Kestra delivered another strong quarter of financial performance, generating revenue growth of 60% while expanding gross margin to over 56%.” — Brian Webster, President and CEO
“We remain confident that our focus on innovation and commercial expansion positions Kestra to generate durable, top-tier growth for years to come.” — Brian Webster, President and CEO
Historical Performance
| Category | Q1 FY2027 | Q1 FY2026 | Change (%) |
| Revenue | $30.97 million | $19.37 million | 59.90% |
| Gross profit | $17.50 million | $8.85 million | 97.70% |
| Gross margin | 56.50% | 45.70% | +10.8 percentage points |
| Net loss | -$44.09 million | −$25.83 million | Loss widened 70.7% |
| Loss per share | −$0.75 | −$0.50 | Loss per share widened 50.0% |
| Operating expenses | $55.16 million | $37.73 million | 46.20% |
| Operating cash flow | −$32.30 million | −$26.27 million | Cash use widened 22.9% |
| Adjusted EBITDA loss | −$24.05 million | −$19.41 million | Loss widened 23.9% |
(Source: Kestra’s unaudited consolidated statements for the three months ended July 31, 2026, and July 31, 2025.)
Competitor Context
Kestra did not provide a formal peer-comparison table in its release. Further, direct quarterly comparisons can be structurally imperfect because wearable cardioverter defibrillator competitors and larger cardiac-device companies often report under different fiscal calendars and business-segment definitions.
| Category | Kestra Q1 FY2027 | Kestra Q1 FY2026 | Change (%) |
| Revenue | $30.97 million | $19.37 million | 59.90% |
| Net loss | −$44.09−$44.09 million | −$25.83−$25.83 million | Loss widened 70.7% |
| Operating expenses | $55.16 million | $37.73 million | 46.20% |
For competitive positioning, Kestra’s report specifically cited wearable cardioverter defibrillator market expansion, competitive share gains, new territories, better in-network penetration, and revenue-cycle improvements as the main growth contributors. However, without aligned current-quarter releases and segment-level disclosures from named peers, a precise competitor revenue and profit comparison would risk being misleading.
How the Market Reacted?
The initial reaction was volatile. One earnings-transcript source reported that KMTS fell 9.43% in after-hours trading to $21.79, after closing the regular September 14 session at $24.06, even as investors weighed faster revenue growth and higher guidance against the larger-than-expected EPS loss.
The following regular session was more favorable: StockTitan tracked a 4.74% gain on September 15, with intraday upside reaching 7.0% and reported volume at 43.5 times the daily average. The mixed sequence suggests investors responded positively to revenue momentum and the guidance increase but remained sensitive to sustained losses, cash burn, debt-related costs, and higher operating expenditures.



