





Introduction
Lead Conversion Rate Statistics: Lead conversion in 2026 is not mainly about grabbing extra contacts, but more about taking demand that is already a fit and turning it into revenue you can track. Buyers move across search, check search results, social posts, email, review pages, AI assistants, and then sales calls, making a single average conversion rate increasingly misleading. Good marketers track the funnel in separate steps from visitor to lead, lead to marketing-qualified lead, sales-qualified lead, opportunity, and customer. They also look at differences by channel, device, industry, and customer type.
This article shares current lead conversion numbers, explains why benchmarks do not match, and shows how speed, landing-page feel, nurturing, data quality, and sales alignment affect outcomes worldwide.
Key Highlights
- The median B2B website conversion rate is around 2.9%. Top groups can go past 8%.
- Landing pages convert at about 6 to 7%. The best pages often hit more than 10%.
- AI search referrals convert near 3.5%. That is roughly 22% higher than standard organic search.
- Desktop conversion sits near 5.06%. Mobile is about 2.49%.
- Industry rates vary. Some sectors show about 2.1%, while Pest Control shows about 3.7%.
- The average Visitor-to-Lead rate is about 2.2% in the 29-industry dataset cited.
- Only 31% of leads turn into MQLs. Then 13 to 21% of MQLs turn into SQLs.
- About 22 to 30% of opportunities become customers. This shows how losses add up at each step.
- Client referrals have the top lead-to-MQL rate at 56%. Executive events follow at 54%.
- SEO or organic leads have a 41% lead-to-MQL rate. PPC is about 29%. Social media is about 30%.
- Companies spend approximately $2,000 on CRO tools, while the CRO software market is projected to reach $1.932 billion by 2026.
- Live chat is associated with 40% higher revenue and 48% higher conversions in the cited source data.
- A machine-learning lead-scoring study increased conversion from 8% to 17%, more than doubling the rate.
- 56% of MQLs reaching sales are not actually a fit, indicating the importance of qualification.
Lead Conversion Rate By Channel
| Channel/stage | 2026 benchmark (approx.) | Note |
| Website (median, all industries) | ~2.9% | Top performers exceed 8% |
| Organic search | ~2.6% | Professional services lead (~5%) |
| ~2.4% | Warm lists hit 10%+ | |
| Paid search | ~1.5% | Depends on landing-page match |
| Paid social | ~0.9% | Lowest intent (browsing audience) |
| Landing pages (median) | ~6–7% | Top performers exceed 10% |
| AI search referrals (ChatGPT, Perplexity) | ~3.5% | ~22% higher than traditional organic |
(Source: floworks.ai)
- A single “good” lead conversion rate does not really exist because performance changes by month with the industry, the traffic source, the device, and buying intent.
- Martal’s 2026 benchmarks put the middle B2B website conversion rate at about 2.9%, with most firms landing in a range near 2% to 5%, and few strong performers go past 8%.
- Organic search sits near 2.6% on average. In professional services, it is closer to 5%, while Email is about 2.4%; with a warm list, it can rise beyond 10%.
- Paid search is lower, around 1.5%, and it depends heavily on how well the landing page matches the ad.
- Paid social is also lower, depending on landing-page relevance, and paid social is lower at about 0.9%.
- Landing pages tend to do better than overall site numbers, with a median for landing pages around 6% to 7%, while top pages hit more than 10%.
- AI search traffic, like ChatGPT and Perplexity, converts around 3.5%, which is about 22% higher than traditional organic search.
- A 1.8% conversion rate is low compared with the legal-services benchmark near 7.4%, but that same 1.8% is higher than the cybersecurity benchmark near 1.0%.
- Desktop converts at about 5.06%. Mobile is about 2.49%, so roughly half; even so, mobile often brings in more visits.
- Use the above benchmarks to judge results by channel, industry, audience, and device mix, not by one universal number.
Industry-Specific Lead Conversion Rates in 2026
| Industry | Conversion Rate |
| Addiction Treatment | 2.10% |
| Apparel & Fashion | 3.20% |
| B2B SaaS | 2.50% |
| Biotech | 2.20% |
| Commercial Insurance | 2.60% |
| Construction | 2.90% |
| eCommerce | 3.20% |
| Engineering | 2.20% |
| Entertainment | 2.30% |
| Environmental Services | 2.10% |
| Financial Services | 2.50% |
| Food & Beverage | 2.80% |
| Healthcare | 2.10% |
| Heavy Equipment | 2.30% |
| Higher Education & College | 2.90% |
| Hotels & Resorts | 3.30% |
| HVAC Services | 2.80% |
| Industrial IoT | 2.30% |
| IT & Managed Services | 2.80% |
| Legal Services | 2.40% |
| Luxury Goods | 2.70% |
| Manufacturing | 3.10% |
| Medical Device | 2.90% |
| Oil & Gas | 2.30% |
| PCB Design & Manufacturing | 3.40% |
| Pest Control | 3.70% |
| Pharmaceutical | 2.40% |
| Real Estate | 2.80% |
| Software Development | 2.90% |
| Solar | 2.30% |
| Staffing & Recruiting | 2.50% |
| Transportation & Logistics | 2.40% |
(Source: firstpagesage.com)
- Martal’s 2026 benchmark set shows that lead-to-customer results do not move in a straight line, and the rates shift by industry because of intent changes, sales work can be harder, pricing models differ, and decision paths are not the same.
- In the set of industries shown, the results span from 2.1% up to 3.7%.
- At the top, Pest Control records 3.7%, followed by PCB Design & Manufacturing with 3.4%, Hotels & Resorts lands at 3.3%, and Apparel & Fashion and eCommerce both come in at 3.2%.
- Manufacturing sits at 3.1%, construction is 2.9%, while Higher Education and College also show 2.9%, and Medical Device and Software Development match that same 2.9% level.
- A mid-range shows up in several places, such as Food & Beverage and HVAC Services at 2.8%, Real Estate at 2.8%, and Luxury Goods at 2.7%.
- Commercial Insurance reaches 2.6%, and B2B SaaS, Financial Services, and Staffing & Recruiting are each at 2.5%.
- Rates of 2.4% for Legal Services, and Pharmaceutical and Transportation & Logistics fall here, while at 2.3% appear for Entertainment plus Heavy Equipment, Industrial IoT, Oil & Gas, and Solar.
- The smallest benchmark group includes Addiction Treatment, Environmental Services, and Healthcare at 2.1%, alongside Biotech and Engineering at 2.2%.
- Overall, the numbers point to the need for industry context. High-cost purchases, technical goods, multiple decision-makers, and longer sales cycles can reduce conversion speed, while urgent needs and clear offers can support stronger results.
Average Lead Conversion Rate by Funnel Stage
(Source: kirro.io)
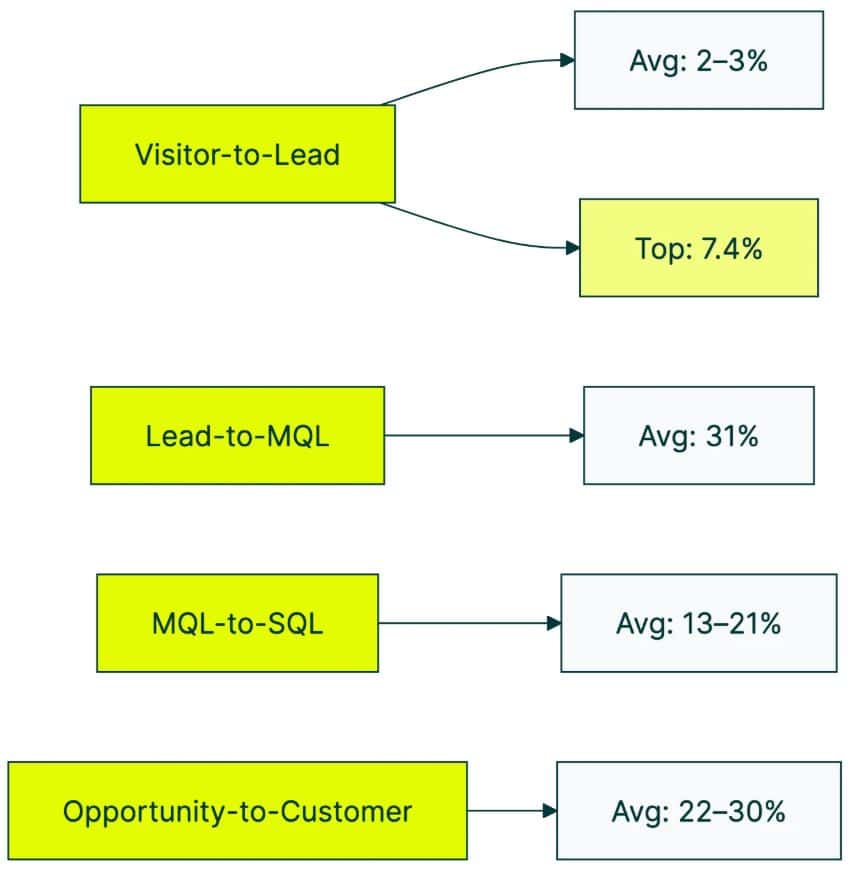
- Lead conversion rates can look better when viewed by checking only one step in the funnel, but the whole path, the picture changes.
- First Page Sage says that across 10 years of data and 29 industries, the Visitor to Lead rate averages near 2.2%.
- After that, about 31% of leads move into MQL status, then roughly 13% to 21% of MQLs turn into SQLs, 30% to 59% of SQLs become opportunities, and about 22% to 30% of opportunities turn into customers.
- With 10,000 visitors, a typical funnel produces around 220 leads, about 68 MQLs, then about 12 SQLs, about 5 opportunities, and only about 1 to 2 customers, implying an overall visitor-to-customer rate of about 0.01% to 0.02%.
- Forrester’s Demand Waterfall work places the lead-to-revenue conversion rate at 0.75%, while best B2B firms reach about 1.54%, pointing to why marketers should be clear about what a “conversion rate” number is measuring.
| Lead source | Lead-to-MQL rate |
| Client referrals | 56% |
| Executive events | 54% |
| SEO / organic | 41% |
| Email marketing | 38% |
| Social media | 30% |
| PPC / paid search | 29% |
| Trade shows | 24% |
| Webinars | 19% |
(Source: kirro.io)
- First Page Sage shows these lead sources to MQL results: referrals at 56%, executive events at 54%, SEO or organic at 41%, email at 38%, social media at 30%, PPC or paid search at 29%, trade shows at 24%, and webinars at 19%.
- Looking at the above figures, funnel efficiency can not be judged from only the main conversion number; marketers need to track lead quality and how leads move from one step to the next.
- Warm sources, like referrals and executive events, tend to push people toward MQL more than paid channels, making source-level analysis essential for understanding where growth is actually coming from.
Lead Scoring and Qualification Improvements
- Lead scoring usually does better when it checks both lead quality and buying actions rather than relying on activity alone.
- One common sign of a weak setup is an MQL-to-SQL rate under 20% indicate a warning that the scoring rules should be updated because too many low-quality leads may be reaching sales.
- A workable approach is to split the score into two parts: fit and engagement. For example, target industry can receive +20 for the right seniority, +15 for ICP-range company size band, and +10 for matching the right tech stack.
- For negative signals, remove 20 points for personal email addresses, 25 points for companies that fall outside the ICP size range, and 30 points for competitor domains.
- A pricing page view could earn +25, a demo request could earn +40, a content download might be worth +10, Webinar attendance could be +15, and an email click could add +5.
- Set the MQL cutoff with care using 3 to 6 months of past data, not a random number, then do quarterly checks so the model stays in line with sales outcomes.
- If sales rejects more than 30% of MQLs as not qualified, then there is a need to change the cutoff or revisit the fit rules.
- Salesforce’s 2026 State of Sales report and HubSpot reports often cite a 15% conversion ratio for BANT-qualified leads. Still, that figure is based on the firms that published it, which is not a strict standard for every market.
Conversion Rate Optimization Statistics by Spending and Budgeting
- Gartner’s Annual CMO Spend Survey says that over half of firms put under 5% of their total marketing money into CRO, indicating many teams give optimization a small slice of the budget.
- Still, 55% of companies plan to raise their CRO spend, suggesting a shift toward better results on websites.
- On average, companies spend about $2,000 on these tools. The goal is to find issues that slow down sign-ups and sales, then lower those barriers.
- The CRO software market was worth $771 million in 2018, forecast to hit $1.932 billion by 2026. That is close to 12.1% of the market, with growth above 150%.
- Live chat can boost revenue by 40% and lift conversions by 48%; exit pop-ups can also help, as linked to a 2% to 5% rise in conversion rate for site visits.
- Overall, the numbers suggest a growing interest in CRO, but the budget share is still small, which shows that many businesses appear to be testing optimization steps. They do not yet treat CRO as a top-line expense.
B2B vs. B2C Lead Conversion Benchmarks
| Benchmark dimension | B2B | B2C ecommerce |
| Broad 2026 planning range | Roughly 2% to 3%. That number sits inside a wider B2B range of 2% to 5% that gets reported. | Most cases fall around 1.5% to 2.5%. In June 2026, the IRP approach placed it at 2.03%. |
| Typical denominator | Refer to leads, MQLs, SQLs, or opportunities. The label depends on the funnel stage. | Tied to website sessions or to users. With IRP, the figure is transactions divided by sessions. |
| Funnel velocity | Usually measured in weeks or months; some enterprise technology cycles span 11–17 months. | Frequently measured within a session or across short remarketing windows. |
| Decision structure | Many groups and many touchpoints. McKinsey says there are ten or more ways people interact. | Often a choice made by one person or a single household. |
| Economic interpretation | Even if the volume is lower, it can still build a lot of pipeline since some contracts are worth more. | Small profit per order can add up when there are more visits, more repeat buys, and more automation. |
| Best diagnostic KPIs | Stage conversion, sales velocity, pipeline generated, win rate, ACV, and cycle length. | Purchase conversion, checkout completion, AOV, CAC, repeat rate, and margin. |
How to Improve Lead Conversion Rates
Enhancing lead conversion doesn’t imply having to redesign your entire funnel from scratch, but it is depending on more practical results can be obtained by optimizing response time, the performance of landing pages, the quality of leads, as well as the visibility of the sales funnel.
Respond within 5 minutes
- Prompt response significantly increases the chances of attracting the lead while interest is at its peak.
- In addition, by automating the scheduling process, it is possible to eliminate delays for potential clients so they can quickly make an appointment.
Optimize lead-capture pages
- Headlines, length of the form, wording of the buttons, and layout of the lead-capture pages directly influence the conversion of visitors into leads.
- A/B testing can contribute to an increase in conversion rates from 20% to 50% without affecting the amount of traffic.
- The main task here is to find out what changes on the page lead to an improvement in the results rather than making those changes based on guesswork.
Enhance lead qualification criteria
- According to Gartner’s research, 56% of MQLs received by the sales team do not match the criteria for an ideal customer profile, meaning the sales team is wasting their time on low-probability leads.
- More sophisticated qualification criteria can be used to create better leads.
- A study conducted by Frontiers in AI f in early 2025 found that the conversion rate of leads increased from 8% to 17% with the help of using machine learning techniques to score leads.
Evaluate each funnel stage
- One single conversion rate may hide where leads are lost in the funnel.
- Calculating conversion rates for the funnel sections such as visitor-to-lead, lead-to-MQL, MQL-to-SQL, or opportunity-to-customer makes the identification of bottlenecks in the funnel easier.
Conclusion
The phenomenon of lead conversion in 2026 can be characterized as a series of measurements connected rather than as a simple percentage. The average website conversion for B2B is around 2.9%, whereas landing pages have a conversion between 6% and 7%, and AI search referrals might bring a 3.5% conversion. Moreover, it becomes even narrower, as about 31% of the leads get converted into MQLs, which represents 22-30% of converted leads from the opportunities.
Moreover, the source context matters in this lead journey. Referrals produce 56% of conversions, whereas the cost of conversion rate optimization keeps rising, and more than 55% are getting ready for bigger budgets. Marketers may find quicker reactions, better qualification, more efficient landing pages, and measuring their journey in various stages helpful while managing lead conversion.
FAQ
The median B2B website conversion rate is about 2.9%.
Client referrals lead at 56%. Executive events come next at 54%.
Desktop sits near 5.06%. Mobile sits near 2.49%.
In the cited funnel, about 31% of leads become MQLs.
More than half put under 5% of their total budget into CRO. At the same time, 55% plan to increase CRO spending.

Sources