








Quick Verdict
Nurix Therapeutics reported fiscal Q3 2026 diluted EPS of $4.73 and revenue of $673.1 million, driven overwhelmingly by Roche licensing revenue. Net income reached $549.8 million, while liquidity approached $1.1 billion. Shares fell approximately 2% in after-hours trading, despite an initial rally, according to contemporaneous market coverage reports.
About Nurix Therapeutics, Inc.
Nurix Therapeutics, Inc. (NASDAQ: NRIX) is a clinical-stage biopharmaceutical company incorporated in 2009 and headquartered in Brisbane, California. Its research focuses on targeted protein degradation, an approach designed to remove disease-causing proteins, alongside medicines that regulate immune-cell activity. The company develops treatments for cancer and autoimmune diseases, with bexobrutideg, an investigational BTK degrader partnered with Roche, leading its clinical portfolio. Other programs include NX-1607, an oral CBL-B inhibitor, and partnered degraders targeting IRAK4 and STAT6.
Around the October 12, 2026 earnings announcement, market coverage placed Nurix’s equity market capitalization at approximately $2.30 billion. A company profile listed 317 full-time employees, although this is a profile figure rather than a newly disclosed quarterly headcount. Its business model combines internal drug development with licensing, research collaborations, and milestone payments. Consequently, quarterly revenue can fluctuate sharply when major contractual payments become recognizable, making clinical progress and funding durability important alongside reported earnings.
Top Financial Highlights
- Total revenue: $673.064 million, compared with $7.894 million in fiscal Q3 2025—an increase of approximately 8,426.3%, calculated using the unrounded financial statements.
- Net income: $549.807 million, reversing a net loss of $86.421 million a year earlier.
- Diluted EPS: $4.73, compared with a loss of $1.03 per share in the prior-year quarter. Basic EPS was $4.93.
- License revenue: $653.156 million, attributable to the Roche collaboration and representing approximately 97.0% of total quarterly revenue.
- Collaboration revenue: $19.908 million, compared with $7.894 million a year earlier. These are reported revenue categories, not separate operating business units.
- Partner-specific disclosure: The revenue discussion identifies a $10 million Sanofi development milestone. The release also highlights $27 million earned from Sanofi, Pfizer, and Gilead arrangements, but that headline should not be treated as a reconciliation of recognized quarterly revenue.
- Research and development expenses: $79.260 million, down approximately 8.0%, primarily reflecting the Roche cost-sharing offset.
- General and administrative expenses: $34.353 million, up approximately 161.1%, primarily because of one-time Roche transaction consulting and business-development expenses.
- Total operating expenses: $113.613 million, up approximately 14.4% from $99.279 million.
- Operating income: $559.451 million, compared with an operating loss of $91.385 million a year earlier.
- Cash on hand: Cash and cash equivalents totaled $720.242 million. Including current and non-current marketable securities, liquidity totaled approximately $1.063 billion, rounded by management to $1.1 billion.
- Guidance: No next-quarter revenue or EPS guidance was provided. Following the $700 million Roche upfront payment, management projected a cash runway into the second half of 2029.
Beat or Miss?
Nurix delivered a revenue beat against the $479.52 million estimate cited by both Seeking Alpha and The Fly’s coverage. The EPS verdict is less clear: contemporaneous reporting used materially different consensus figures, so a single unqualified earnings-beat claim would be misleading.
| Metric | Reported | Difference/Analysis |
| Revenue | $673.064 million | Approximately $193.54 million, or 40.4%, above the $479.52 million estimate cited by The Fly. Seeking Alpha reports a $193.58 million beat using its displayed figures. |
| GAAP diluted EPS | $4.73 | Seeking Alpha reports a $1.64 beat, implying a $3.09 estimate. The Fly instead cites $5.11 consensus, implying a $0.38 miss. These estimates are not reconciled. |
| Net income | $549.807 million | Comparable consensus estimate not available in the reviewed reporting. |
| Total operating expenses | $113.613 million | Comparable consensus estimate not available; expenses increased 14.4% year over year. |
| Liquidity | Approximately $1.063 billion | Management rounded the balance to $1.1 billion and guided to funding into the second half of 2029; no comparable consensus figure was provided. |
The underlying distinction is revenue quality: the $653.156 million Roche license contribution drove most of the reported revenue and profitability. Investors should not interpret this quarter as evidence of an equivalent recurring commercial-sales run rate.
Nurix Therapeutics, Inc.Condensed Balance Sheets
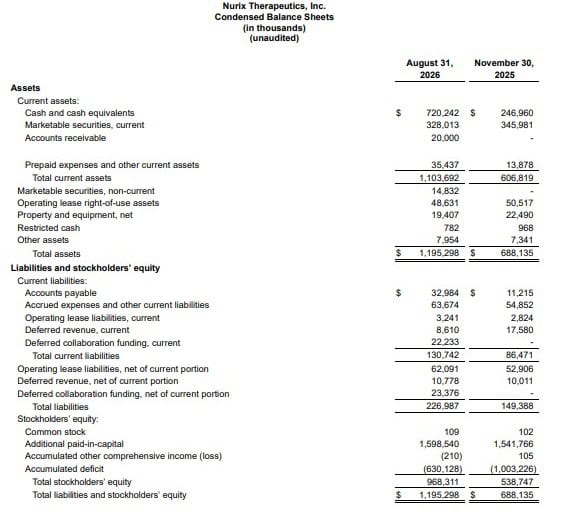
(Source: ir.nurixtx.com)
- The table presents the unaudited condensed balance sheets of Nurix Therapeutics, Inc., comparing its financial position as of August 31, 2026, with November 30, 2025. All figures are reported in thousands. Total assets increased from $688.1 million to $1,195.3 million, representing growth of approximately 73.7%.
- This increase was primarily reflected in cash and cash equivalents, which rose from $247.0 million to $720.2 million. Total current assets also increased from $606.8 million to $1,103.7 million, indicating a stronger current asset position. Meanwhile, total liabilities increased from $149.4 million to $227.0 million, while total stockholders’ equity grew from $538.7 million to $968.3 million.
- The accumulated deficit narrowed from $1,003.2 million to $630.1 million. Overall, the balance sheet shows higher asset holdings, substantially increased cash reserves, and improved stockholders’ equity compared with November 2025.
What Leadership Is Saying
“The third quarter marked an important transition for Nurix as we moved bexobrutideg into Phase 3 development in CLL and began executing a broader clinical strategy designed to realize its potential across lines of therapy in both oncology and auto-immune disease.” – Arthur T. Sands, M.D., Ph.D., president and chief executive officer
The release does not contain a CFO quotation. Rather than inventing an executive comment, the financial outlook is reproduced below as an unattributed company statement:
“Following receipt of the $700 million upfront as part of the close of the Roche collaboration, Nurix has $1.1 billion in cash, cash equivalents and marketable securities, and runway into the second half of 2029.”
The collaboration also changes future development economics: Nurix will fund 40% of development costs and Roche 60%, while U.S. profits and losses will be shared equally. Nurix is eligible for tiered royalties on sales outside the United States.
Historical Performance
Nurix: Fiscal Q3 2026 versus fiscal Q3 2025
Amounts are in U.S. dollars. Percentage changes below use the unrounded figures in the company’s financial statements.
| Category | Q3 FY2026 | Q3 FY2025 | Change (%) |
| Revenue | $673.064 million | $7.894 million | 8426.30% |
| Net income/(loss) | $549.807 million | ($86.421 million) | N/M—turned profitable; $636.228 million improvement |
| Operating expenses | $113.613 million | $99.279 million | 14.40% |
| Research and development | $79.260 million | $86.120 million | −8.0% |
| General and administrative | $34.353 million | $13.159 million | 161.10% |
| Diluted EPS | $4.73 | ($1.03) | N/M—$5.76 improvement |
Source: Nurix’s October 12, 2026 earnings release. N/M means a percentage growth comparison is not meaningful because the result changed from a loss to a profit.
The expense mix explains why R&D savings did not translate into lower total operating costs: the reduction in research spending was more than offset by higher administrative expenses associated with the Roche transaction.
Competitors: Latest verified reported quarters versus the prior year
The peer comparison uses Q2 2026 results ended June 30, rather than presenting them incorrectly as Q3 results. Arvinas and Kymera provide relevant targeted-protein-degradation comparisons, but their reporting periods do not align exactly with Nurix’s August 31 fiscal quarter-end.
| Category | Q2 2026 | Q2 2025 | Change (%) |
| Arvinas—Revenue | $249.7 million | $22.4 million | 1014.70% |
| Arvinas—Net income/(loss) | $169.4 million | ($61.2 million) | N/M—turned profitable |
| Arvinas—Operating expenses | $85.6 million | $93.9 million | −8.8% |
| Kymera—Revenue | $65.000 million | $11.476 million | 466.40% |
| Kymera—Net income/(loss) | ($61.211 million) | ($76.614 million) | Net loss narrowed 20.1% |
| Kymera—Operating expenses | $140.607 million | $96.033 million | 46.40% |
Sources: Arvinas’s Q2 earnings announcement and quarterly-filing coverage; Kymera’s Q2 earnings announcement. Changes are calculated from the displayed figures.
These peers demonstrate why collaboration accounting matters when comparing biotechnology earnings. Arvinas’s quarter included substantial licensing and collaboration-related revenue, while Kymera recognized a $45 million Gilead option-exercise fee and a $20 million Sanofi milestone. Their revenue increases therefore do not represent straightforward growth in recurring product sales.
How the Market Reacted?
Nurix shares fell approximately 2% in after-hours trading following the October 12 release, according to Investing.com coverage carried by Yahoo Finance, after initially rising nearly 8%. The figures describe movement during the after-hours session, not a verified final after-hours closing price.
The report combined a substantially stronger funding position and Phase 3 progress with higher total operating expenses and heavy dependence on Roche license revenue for quarterly profit. The available coverage does not establish a definitive cause for the stock reversal.



