









Quick Verdict
The latest Hubbell Incorporated Q3 2026 Earnings report shows the company reported adjusted EPS of $5.91 and revenue of $1.873 billion, beating analyst expectations as data-center demand accelerated. GAAP EPS reached $4.94. Management raised its full-year earnings outlook, but shares fell approximately 6% during October 27 trading as the revised forecast broadly matched Wall Street expectations rather than exceeding them.
About Hubbell Incorporated
Hubbell Incorporated (NYSE: HUBB) manufactures utility and electrical products that help customers operate critical infrastructure safely, reliably, and efficiently. Founded in 1888 by inventor Harvey Hubbell II, the company is headquartered in Shelton, Connecticut. Its portfolio serves electricity transmission and distribution networks, substations, data centers, industrial facilities, and other electrical infrastructure applications. Hubbell organizes its operations into two reporting segments: Utility Solutions and Electrical Solutions. The former supports grid infrastructure and automation, while the latter supplies electrical products across commercial and industrial markets.
Hubbell reported approximately 18,000 employees at the end of 2025 and generated $5.8 billion in revenue that year. An earnings-day market report placed its market capitalization at approximately $24.27 billion, although that valuation changes with its share price. Its latest results highlight two growth engines—grid investment and data-center construction—with acquisitions adding substantially to revenue alongside double-digit companywide organic sales growth in the September quarter.
Top Financial Highlights
- Total revenue: $1,872.5 million, up approximately 25% from $1,502.4 million a year earlier.
- Organic growth: Approximately 11%; acquisitions contributed another 13 percentage points to reported sales growth.
- Consolidated net income: $264.6 million, versus $256.7 million in Q3 2025.
- Net income attributable to Hubbell: $262.5 million, compared with $255.5 million a year earlier.
- Earnings per share: GAAP diluted EPS of $4.94, versus $4.77; adjusted diluted EPS of $5.91, versus $5.17.
- Gross profit and margin: Gross profit reached $688.2 million. Gross margin was approximately 36.8%, calculated as gross profit divided by revenue, versus approximately 36.2% a year earlier.
- Operating profitability: GAAP operating income reached $408.7 million, with a 21.8% margin; adjusted operating income was $476.8 million, with a 25.5% margin.
- Operating cash flow: $323 million for the quarter, compared with $284 million in Q3 2025.
- Free cash flow: $280 million, versus $254 million a year earlier.
- Utility Solutions revenue: Approximately $1,028 million, up 9%, including approximately 5% organic growth.
- Electrical Solutions revenue: Approximately $845 million, up 51%, including 22% organic growth and a 29-percentage-point acquisition contribution.
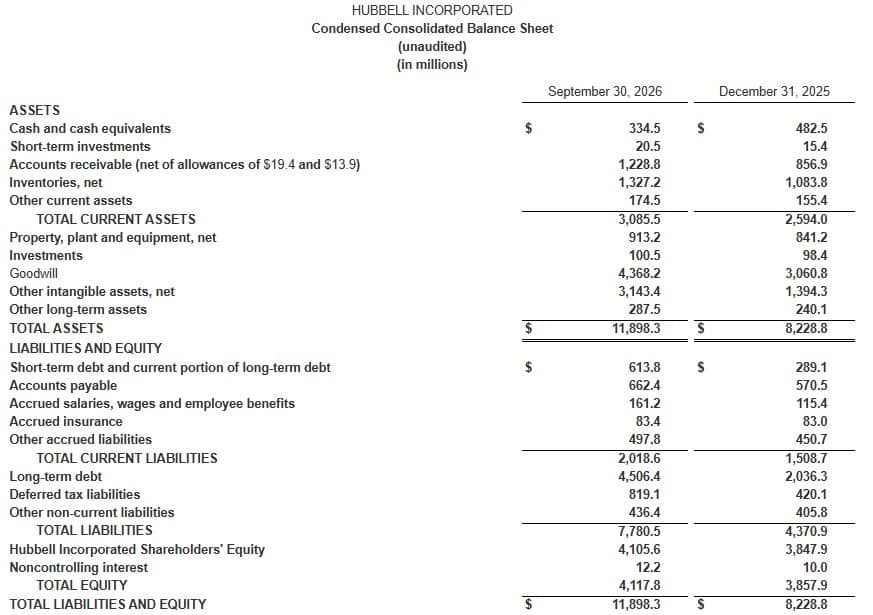
- Cash on hand: Cash and cash equivalents totaled $334.5 million at September 30, 2026; short-term investments added $20.5 million.
- Full-year guidance: Management raised adjusted EPS guidance to $20.40–$20.60 and forecast GAAP EPS of $17.30–$17.50, with total sales growth of 18%–19%
Hubbell Incorporated Condensed Consolidated Balance Sheet
Beat or Miss?
Hubbell delivered a beat on adjusted EPS and revenue. Revenue consensus differed between published sources: some cited approximately $1.85 billion, while an S&P-based report cited approximately $1.86 billion. Both were below reported sales.
| Metric | Reported | Difference/Analysis |
| Adjusted diluted EPS | $5.91 | Consensus: $5.75; beat by $0.16, or approximately 2.8%. |
| Revenue | $1,872.5 million | Consensus: approximately $1.85 billion–$1.86 billion, depending on provider; exceeded both benchmarks. hubbell. |
| GAAP diluted EPS | $4.94 | Comparable GAAP consensus: N/A in the reviewed sources; increased from $4.77 a year earlier. |
| Adjusted operating margin | 25.50% | Consensus: N/A; expanded 160 basis points year over year. |
| FY2026 adjusted EPS guidance | $20.40–$20.60 | Midpoint of $20.50 broadly matched the approximately $20.51 analyst expectation cited in market coverage. |
The distinction between GAAP and adjusted earnings matters. Quarterly adjusted EPS excluded $0.89 per share of acquisition-related intangible amortization and $0.08 of transaction, integration, and separation costs. Meanwhile, net interest expense increased to $58.0 million from $13.6 million, helping explain why GAAP earnings grew more slowly than adjusted operating profit.
What Leadership Is Saying
Chairman, President and CEO Gerben Bakker connected strong demand and growing backlog with continued investment:
“Orders and end market demand remained strong, driving continued backlog build in the quarter, and we remain focused on proactively investing in capacity expansion to serve our customers in high growth areas.”
Bakker said Electrical Solutions benefited from strong data-center markets, additional product content, and capacity expansion. He also said NSI’s performance and integration were trending ahead of initial expectations.
The earnings release does not contain a direct CFO quotation. The following is an attributed paraphrase—not a verbatim quotation—from published earnings-call coverage:
CFO Joseph Capozzoli attributed Electrical Solutions’ margin strength to organic growth in high-margin data-center products and NSI’s contribution. He cautioned that Q3 is seasonally the strongest revenue and margin quarter and should not be treated as the ongoing run rate.
That qualification is important: the same coverage identified expected Q4 Utility Solutions margin pressure from inflation, capacity and product investments, and customer-related tariff considerations.
Historical Performance
Amounts below are in millions of U.S. dollars. Percentage changes are calculated from the reported figures; operating expenses are represented by selling and administrative expenses, with cost of goods sold shown separately.
| Category | Q3 2026 | Q3 2025 | Change (%) |
| Revenue | $1,872.50 | $1,502.40 | 24.60% |
| Consolidated net income | $264.60 | $256.70 | 3.10% |
| Net income attributable to Hubbell | $262.50 | $255.50 | 2.70% |
| Selling and administrative expenses | $279.50 | $213.70 | 30.80% |
| Cost of goods sold | $1,184.30 | $958.10 | 23.60% |
| Operating income | $408.70 | $330.60 | 23.60% |
Sales growth substantially outpaced attributable net income growth. Although gross profitability improved, higher selling and administrative expenses, acquisition-related amortization, interest expense, and income taxes limited the increase in bottom-line earnings. GAAP operating margin slipped to 21.8% from 22.0%, even as adjusted operating margin rose to 25.5% from 23.9%.
How the Market Reacted?
Hubbell shares fell approximately 6% during October 27 trading, according to an earnings-day market report; that figure is not a verified closing return or after-hours move. Despite the quarterly beat, the revised full-year adjusted EPS midpoint of $20.50 broadly matched expectations, giving investors limited upside surprise from the guidance increase.
Strong Electrical Solutions performance contrasted with slower Utility Solutions organic growth and a roughly 4% decline in Grid Automation sales. Earnings-call coverage also highlighted fourth-quarter utility margin pressure, tempering the otherwise positive growth picture.

Sources