Boardwalk REIT reported Q1 2026 rental revenue of CAD 163.8 million, up 5.2% year over year, with FFO per unit of CAD 1.15, an 8.5% increase from Q1 2025. Net income swung to a small loss due to fair value adjustments, while NOI rose 10%. After hours movement was not disclosed.
About Boardwalk REIT
Boardwalk Real Estate Investment Trust is a Canadian multi-family residential REIT listed on the Toronto Stock Exchange under the ticker BEI.UN. The trust owns more than 200 communities with approximately 34,000 residential suites totaling about 30 million net rentable square feet across Canada. Boardwalk is headquartered in Calgary, Alberta and positions itself as a leading provider of affordable rental housing, focusing on Alberta, Quebec, Saskatchewan, Ontario and British Columbia.
Unitholders’ equity stood at about CAD 4.8 billion as of March 31, 2026, with net asset value of roughly CAD 5.0 billion or CAD 95.93 per unit. The trust reported total available liquidity of about CAD 434.9 million and total mortgage principal outstanding of roughly CAD 3.61 billion at quarter end. At a recent unit price near CAD 66, management estimates an implied value of about CAD 199,000 per suite, equating to a cap rate of roughly 6.3% on trailing NOI.
Top Financial Highlights
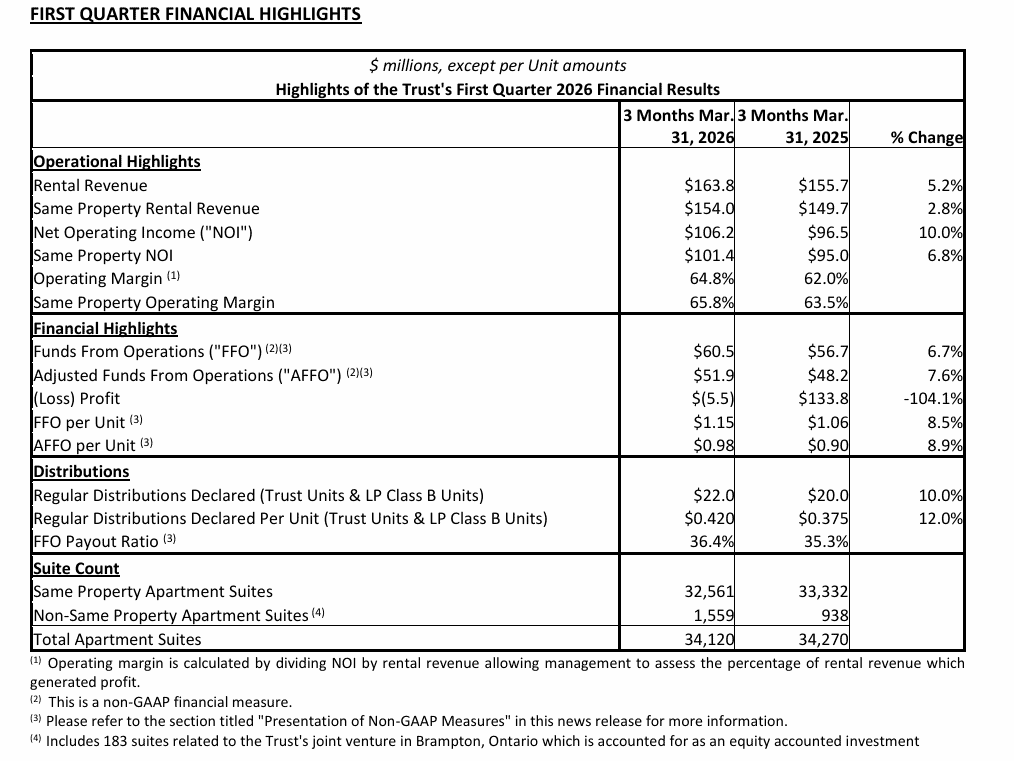
- Q1 2026 rental revenue rose to CAD 163.8 million, up 5.2 percent from CAD 155.7 million in Q1 2025.
- Same property rental revenue increased 2.8 percent year over year to about CAD 154.0 million.
- Net Operating Income reached CAD 106.2 million, a 10.0 percent increase from CAD 96.5 million a year earlier.
- Same property NOI was CAD 101.4 million, up 6.8 percent from CAD 95.0 million in Q1 2025.
- Operating margin improved to 64.8 percent, compared with 62.0 percent in the prior year quarter, while same property operating margin rose to 65.8 percent from 63.5 percent.
- Funds From Operations totaled CAD 60.5 million, up 6.7 percent from CAD 56.7 million in Q1 2025.
- FFO per unit was CAD 1.15, an 8.5 percent increase from CAD 1.06 in the prior year period.
- Adjusted Funds From Operations were CAD 51.9 million, or CAD 0.98 per unit, up from CAD 48.2 million and CAD 0.90 per unit in Q1 2025.
- The trust reported a net loss of CAD 5.5 million, versus net income of CAD 133.8 million a year earlier, largely due to fair value losses on investment properties and related items.
- Regular cash distributions declared were CAD 22.0 million in total, or CAD 0.42 per unit, up 12 percent from CAD 0.375 per unit in Q1 2025.
- Cash and cash equivalents were CAD 157.6 million, contributing to total available liquidity of about CAD 434.9 million including unused credit facilities and committed financing.
- Same property occupancy averaged 97.3 percent in Q1 2026, with period end average occupied rent of CAD 1,601 per month, up from CAD 1,538 a year earlier.
- Management raised its 2026 FFO per unit guidance to a range of CAD 4.60 to CAD 4.80 and now targets CAD 400 to CAD 500 million of asset sales in 2026.
- The trust confirmed a regular distribution of CAD 0.15 per unit per month for June, July and August 2026, equivalent to CAD 1.80 annualized.
Beat or Miss?
Public filings and the release highlight that Boardwalk “delivered another strong quarter,” but do not provide explicit consensus analyst estimates for revenue, FFO or NOI. Where only directional comments are given, consensus expectations are summarized qualitatively.
| Metric | Reported Q1 2026 | Difference or Analysis |
| Rental revenue | CAD 163.8 million | Up 5.2 percent year over year, described as strong growth; analyst consensus not disclosed, so numerical beat or miss is N/A. |
| FFO per unit | CAD 1.15 | Up 8.5 percent from CAD 1.06; management frames results as strong and consistent with updated full year guidance, consensus figure not provided. |
| NOI | CAD 106.2 million | Increased 10.0 percent versus Q1 2025, reflecting improved margins and cost control; no explicit analyst benchmark given. |
| Net income | Net loss CAD 5.5 million | Down from profit of CAD 133.8 million a year ago, driven mainly by non cash fair value changes, not by core operating weakness. |
| Same property NOI growth | 6.8 percent | Positive and ahead of same property revenue growth as expenses declined; management still guides to full year same property NOI growth of 1.0 to 3.5 percent. |
| 2026 FFO per unit guidance | CAD 4.60 to 4.80 | Range narrowed from CAD 4.65 to 4.90 prior guidance; reflects updated tax and asset sale assumptions rather than a directional miss on Q1. |
What Leadership Is Saying?
“We are pleased to have delivered another strong quarter, with Funds From Operations of CAD 1.15 per Unit, up 8.5 percent year over year, and Net Operating Income of CAD 106.2 million, up 10.0 percent from Q1 2025. These results reflect the resilience of affordable housing and the strength of our vertically integrated operating platform, which continues to perform across market conditions and drive meaningful operating margin improvement.”
“We are committed to retaining a strong and flexible balance sheet and are pleased to have taken strides this quarter on further improving our Debt to EBITDA ratio. Our financial strength gives us the flexibility to fund our value add program through internal cash flow while allocating proceeds from sales opportunistically to maximize risk adjusted returns for our Unitholders.”
Historical Performance
Boardwalk REIT Q1 2026 vs Q1 2025
| Category | Q1 2026 | Q1 2025 | Change (%) |
| Rental revenue | CAD 163.8 million | CAD 155.7 million | 5.2% increase |
| Net income | Net loss (small) | CAD 133.8 million | More than 100% swing due to fair value movements |
| NOI | CAD 106.2 million | CAD 96.5 million | 10.0% increase |
| Same property NOI | CAD 101.4 million | CAD 95.0 million | 6.8% increase |
| Operating margin | 64.80% | 62.00% | 2.8% point expansion |
| FFO per unit | CAD 1.15 | CAD 1.06 | 8.5% increase |
| AFFO per unit | CAD 0.98 | CAD 0.90 | 8.9% increase |
How the Market Reacted?
The Q1 2026 release describes the quarter as strong and highlights that the current unit price around CAD 66 implies a cap rate of roughly 6.3 percent, which management presents as attractive versus recent private market valuations. The materials do not state the exact same day or after hours percentage move in the unit price following the announcement. Overall tone from management and the financial metrics signal a bullish sentiment, with solid FFO and NOI growth, higher distributions and active unit buybacks supporting the investment case despite a headline net loss driven by non cash fair value items.
