
Enbridge posted Q1 2026 adjusted EPS of $0.71 (USD), beating the Zacks consensus estimate of $0.69, while revenue of $16.3 billion surpassed consensus by 27.09%. GAAP EPS came in at $0.77 (CAD). Shares closed at $53.59 on May 8, 2026, down 0.74% on the day, with a modest after-hours uptick to $53.72.
About Enbridge Inc.
Enbridge Inc. (TSX: ENB / NYSE: ENB) is a Calgary, Alberta-headquartered energy infrastructure giant founded in 1949 as the Interprovincial Pipe Line Company. The company safely connects millions of people to the energy they rely on every day through its North American natural gas, oil, and renewable power networks, as well as a growing European offshore wind portfolio.
Enbridge owns and operates the world’s longest crude oil pipeline system, spanning 28,661 kilometres across Canada and the United States, along with a 38,300-kilometre natural gas pipeline network. As of May 8, 2026, Enbridge carries a market cap of approximately $116.9 billion USD, a P/E ratio of 22.83, and a dividend yield of 5.1%. The company employs approximately 16,000 people primarily in the United States and Canada.
Top Financial Highlights
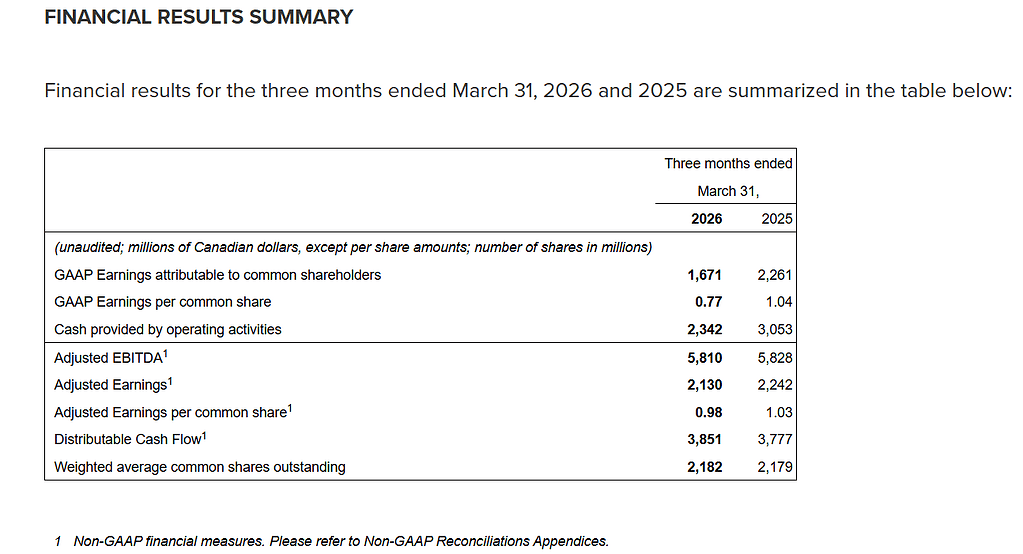
- GAAP earnings attributable to common shareholders: $1.671 billion, or $0.77 per share (vs. $2.261 billion or $1.04 in Q1 2025)
- Adjusted earnings: $2.130 billion, or $0.98 per common share (vs. $2.242 billion or $1.03 in Q1 2025)
- Adjusted EBITDA: $5.810 billion, essentially flat versus $5.828 billion in Q1 2025
- Distributable Cash Flow (DCF): $3.851 billion, up from $3.777 billion in Q1 2025
- Cash provided by operating activities: $2.342 billion (vs. $3.053 billion in Q1 2025)
- Revenue (USD-reported): $16.3 billion, beating Zacks consensus estimate by 27.09%
- Liquids Pipelines adjusted EBITDA: $2.303 billion (vs. $2.621 billion in Q1 2025)
- Gas Transmission adjusted EBITDA: $1.518 billion (vs. $1.439 billion in Q1 2025)
- Gas Distribution and Storage adjusted EBITDA: $1.709 billion (vs. $1.600 billion in Q1 2025)
- Renewable Power Generation adjusted EBITDA: $202 million (vs. $241 million in Q1 2025)
- Secured growth capital backlog: $40 billion, up approximately $2 billion this quarter
- 2026 full-year guidance reaffirmed: Adjusted EBITDA of $20.2 billion to $20.8 billion; DCF per share of $5.70 to $6.10
- Common share quarterly dividend declared at $0.9700 per share, payable June 1, 2026
- Debt-to-EBITDA at 5.0x, aligned with company target range of 4.5 to 5.0x
Beat or Miss?
| Metric | Reported | Estimated | Difference |
| Adjusted EPS (USD) | $0.71 | $0.69 (consensus) | Beat by +$0.02 (+2.90%) |
| Revenue | $16.3 billion | $8.49 billion (consensus) | Beat by +$7.81 billion (+27.09%) |
| Adjusted EBITDA | $5.810 billion (CAD) | In line with prior year $5.828 billion | Essentially flat, -$18 million |
| DCF per share | CAD $0.03 YoY increase | No specific consensus | Positive beat vs. prior year |
| Full-year EBITDA guidance | $20.2B to $20.8B reaffirmed | N/A | Guidance maintained, no revision |
What Leadership Is Saying?
“I am proud of the consistency of our performance this quarter, which once again reflects the strength of our diversified, low-risk business model. We’re on track to meet our financial guidance once again this year, and maintained our dividend aristocrat status with another year of dividend increases, further reinforcing our status as a first-choice investment opportunity.”
Greg Ebel, President and CEO, Enbridge Inc.
“The first quarter was a strong start to the year, reflecting solid financial performance and continued execution across our businesses. Adjusted EBITDA remained consistent with the prior year period, while distributable cash flow per share rose by CAD $0.03. Our capital allocation strategy remains unchanged, supported by equity self-funding and regulated and predictable cash flows, with a CAD $40 billion secured capital backlog extending through 2033.”
Patrick Murray, Executive Vice President and CFO, Enbridge Inc.
Historical Performance
| Category | Q1 2026 | Q1 2025 | Change (%) |
| Revenue (USD-reported) | $16.3 billion | $12.89 billion | 26.50% |
| GAAP Net Earnings (CAD) | $1.671 billion | $2.261 billion | -26.10% |
| Adjusted EBITDA (CAD) | $5.810 billion | $5.828 billion | -0.30% |
| Adjusted EPS (CAD) | $0.98 | $1.03 | -4.90% |
| DCF (CAD) | $3.851 billion | $3.777 billion | 2.00% |
| Cash from Operations (CAD) | $2.342 billion | $3.053 billion | -23.30% |
The decline in GAAP net earnings was primarily driven by non-cash, unrealized changes in the value of derivative financial instruments used to manage foreign exchange, interest rate, and commodity price risks, along with the absence of a one-time litigation settlement that boosted Q1 2025 results. Adjusted EBITDA held nearly flat, demonstrating the underlying resilience of Enbridge’s diversified business model.
Competitor Comparison Q1 2026 vs Q1 2025
The following table benchmarks Enbridge against its two closest North American pipeline and midstream infrastructure peers, TC Energy and Pembina Pipeline, for the same quarterly period.
| Category | Q1 2026 | Q1 2025 | Change (%) |
| Enbridge Revenue (USD) | $16.3 billion | $12.89 billion | 26.50% |
| Enbridge Net Earnings (CAD) | $1.671 billion | $2.261 billion | -26.10% |
| Enbridge Adjusted EBITDA (CAD) | $5.810 billion | $5.828 billion | -0.30% |
| TC Energy Comparable EBITDA (CAD) | $3.1 billion | $2.7 billion | 14.80% |
| TC Energy Net Income (CAD) | $0.9 billion | $1.0 billion | -10.00% |
| TC Energy Comparable EPS (CAD) | $0.99 | $0.95 | 4.20% |
| Pembina Pipeline Revenue (CAD) | $2.106 billion | $2.282 billion | -7.70% |
| Pembina Pipeline Net Earnings (CAD) | $498 million | $502 million | -0.80% |
| Pembina Pipeline Adjusted EBITDA (CAD) | $1.131 billion | $1.167 billion | -3.10% |
Enbridge remains the clear scale leader among North American midstream operators, with adjusted EBITDA nearly double that of TC Energy and more than five times that of Pembina Pipeline. TC Energy showed the strongest EBITDA growth at +14.8% YoY, driven by strong performances in Mexico and its Power and Energy Solutions segment, while both Enbridge and Pembina saw slight year-over-year EBITDA compression.
How the Market Reacted?
ENB shares closed at $53.59 on May 8, 2026, down 0.74% on the day results were published, and ticked up slightly to $53.72 in after-hours trading, a gain of 0.25%. The stock has risen approximately 12.0% since the start of 2026 from an opening price of $47.85, reflecting strong investor confidence in Enbridge’s stable cash flows and dividend profile ahead of the earnings release.
The muted reaction on earnings day was consistent with the “in line” nature of the adjusted EBITDA result and reflects that the 2026 guidance reaffirmation, rather than an upward revision, was the key takeaway for investors. Overall market sentiment remains bullish on the stock, supported by a reaffirmed 5% annual EBITDA and DCF per share growth outlook through decade-end and a CAD $40 billion to $45 billion shareholder return target over the next five years.
