
Oppenheimer Holdings (NYSE: OPY) posted Q1 2026 GAAP EPS of -$1.93 on revenue of $445.1 million, up 21.0% year-over-year. A one-time $70 million legal accrual for “cash sweep” litigation drove the net loss. Adjusted (non-GAAP) EPS was $4.46. Shares fell 6.70% to $106.81 on earnings day.
About Oppenheimer Holdings Inc.
Oppenheimer Holdings Inc.(NYSE: OPY) is a leading middle market investment bank and full-service broker-dealer headquartered in New York City, with roots tracing back to 1881. The firm operates across retail securities brokerage, institutional sales and trading, investment banking, equity and fixed income research, market-making, trust services, and investment advisory and asset management. It maintains 88 retail branch offices across the United States and holds institutional operations in London, Tel Aviv, and Hong Kong.
As of May 1, 2026, OPY carries a market capitalization of approximately $1.14 billion and trades at a P/E multiple of 8.78. The company employs 932 financial advisors as of the end of Q1 2026 and manages $54.1 billion in assets under management (AUM). The quarterly dividend was raised 11.1% to $0.20 per share, payable May 29, 2026.
Top Financial Highlights
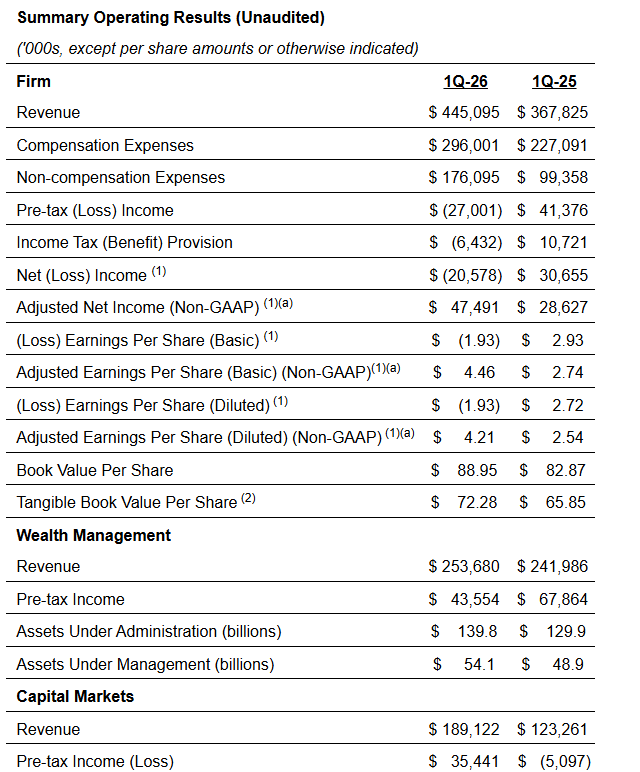
- Total Revenue of $445.1 million, up 21.0% from $367.8 million in Q1 2025
- GAAP Net Loss of -$20.6 million, or -$1.93 per basic/diluted share
- Adjusted (Non-GAAP) Net Income of $47.5 million, or $4.46 adjusted basic EPS (up from $2.74 a year ago)
- Adjusted Diluted EPS of $4.21 versus $2.54 a year ago
- Pre-tax loss of -$27.0 million versus pre-tax income of $41.4 million in Q1 2025
- $70 million pre-tax legal accrual for “cash sweep” class-action litigation settlement
- $22.3 million pre-tax mark-to-market expense from liability-based stock appreciation rights for financial advisors, driven by a $16.90 per-share rise in OPY stock during the quarter
- Wealth Management segment revenue of $253.7 million, up 4.8% YoY; pre-tax income of $43.6 million
- Capital Markets segment revenue of $189.1 million, up 53.4% YoY; pre-tax income of $35.4 million (vs. a loss of $5.1 million a year ago)
- Investment banking fees surged 105.2% YoY to $97.7 million at the consolidated level
- AUM at $54.1 billion (up $5.2 billion YoY), and assets under administration at $139.8 billion
- Cash and cash equivalents of $34.6 million; stockholders’ equity of $952.4 million
- Quarterly dividend raised 11.1% to $0.20 per share, payable May 29, 2026
Beat or Miss?
| Metric | Reported | Analysis |
| Total Revenue | $445.1 million | Beat Street forecasts per market commentary |
| GAAP EPS | ($1.93) | Impacted by one-time $70M legal accrual and $22.3M SARs charge |
| Adjusted Basic EPS | $4.46 | Up 62.8% from adjusted $2.74 in Q1 2025 |
| Adjusted Diluted EPS | $4.21 | Up 65.7% from adjusted $2.54 in Q1 2025 |
| Adjusted Net Income | $47.5 million | Up 65.9% from $28.6 million in Q1 2025 |
| Capital Markets Revenue | $189.1 million | Up 53.4% YoY; strongest performance in recent quarters |
| AUM | $54.1 billion | Up $5.2 billion (~11.6%) YoY driven by market appreciation |
What Leadership Is Saying?
The Q1 2026 press release included extended commentary from Robert S. Lowenthal, President and CEO.
“Notwithstanding the unfavorable impact of the ‘cash sweep’ settlement on the Company’s overall results for the first quarter, the Firm’s core businesses delivered solid operating results. Despite an increasingly challenging geopolitical environment, the strength of our franchise proved its ability to support clients across all business environments.” – Robert S. Lowenthal, President and CEO
“We are pleased to have resolved the ‘cash sweep’ litigation and to put this matter behind us. Despite the settlement’s negative impact to our quarterly results, our operating businesses performed well. Our capital position remains robust, enabling us to return additional value to stockholders as highlighted by our announced 11.1% increase in the quarterly dividend to $0.20 per share.” – Robert S. Lowenthal, President and CEO (on financial position and capital return)
Historical Performance
| Category | Q1 2026 | Q1 2025 | Change (%) |
| Total Revenue | $445.1 million | $367.8 million | +21.0% |
| GAAP Net (Loss) Income | -$20.6 million | +$30.7 million | -167.1% |
| Adjusted Net Income (Non-GAAP) | $47.5 million | $28.6 million | +65.9% |
| Compensation Expenses | $296.0 million | $227.1 million | +30.3% |
| Non-compensation Expenses | $176.1 million | $99.4 million | +77.2% |
| Total Expenses | $472.1 million | $326.4 million | +44.6% |
| Pre-tax (Loss) Income | -$27.0 million | +$41.4 million | -165.3% |
| Basic (Loss) EPS | ($1.93) | $2.93 | -165.9% |
| Adjusted Basic EPS | $4.46 | $2.74 | +62.8% |
| AUM | $54.1 billion | $48.9 billion | +10.6% |
| Wealth Management Revenue | $253.7 million | $242.0 million | +4.8% |
| Capital Markets Revenue | $189.1 million | $123.3 million | 53.40% |
Competitor Historical Performance
| Category | Oppenheimer (OPY) Q1 2026 | Oppenheimer (OPY) Q1 2025 | Change (%) | Piper Sandler (PIPR) Q1 2026 | Piper Sandler Q1 2025 | Change (%) | Stifel (SF) Q1 2026 | Stifel Q1 2025 | Change (%) |
| Net Revenue | $445.1M | $367.8M | +21.0% | $474.4M | $356.7M | +33.0% | $1.48B | $1.26B | +17.7% |
| GAAP Net Income | -$20.6M | $30.7M | -167.1% | $65.2M | $64.5M | +1.1% | $242.1M | $43.7M | +454.2% |
| Non-GAAP Net Income | $47.5M | $28.6M | +65.9% | $71.9M | N/A | N/A | $237.5M | $54.2M | +338.2% |
| Total Operating Expenses | $472.1M | $326.4M | +44.6% | N/A | N/A | N/A | N/A | N/A | N/A |
| Compensation Ratio | 66.50% | 61.70% | +4.8pp | N/A | N/A | N/A | 57.40% | 58.30% | -0.9pp |
| Pre-tax Margin | N/M (loss) | 11.30% | N/M | 18.50% | N/A | N/A | 22.10% | 5.00% | +17.1pp |
N/M = Not Meaningful; pp = percentage points
How the Market Reacted?
Shares of Oppenheimer Holdings (OPY) fell 6.70% on earnings day, closing at $106.81 on May 1, 2026, after opening at $114.85 and reaching an intraday high of $115.60 before selling off. The move came despite adjusted earnings significantly beating prior-year levels, as the market appeared to focus on the headline GAAP net loss of $20.6 million driven by the $70 million legal charge.
Prior to earnings, OPY had gained roughly 58% year-to-date as of April 30, 2026, reflecting strong investor sentiment around the firm’s improving core fundamentals. The post-earnings pullback is viewed as a technical correction following the elevated run-up, with the core operating business broadly considered healthy given the 21% revenue growth and record-level Capital Markets performance.
