








Opening section
PhonePe Statistics: PhonePe is one of India’s most trusted digital payment apps, making online transactions quick, safe, and simple. Since its launch in 2015, UPI has changed the way people send money, pay bills, recharge mobiles, shop online, and make everyday payments. Over the years, PhonePe has expanded beyond payments to offer services such as insurance, investments, loans, and wealth management. Its easy-to-use design and reliable service have made it a popular choice for millions of users and businesses across the country.
As India moves toward a digital-first future, PhonePe continues to make financial services more accessible, helping people manage their money with greater ease and confidence.
Expert Pick
- PhonePe’s revenue from operations increased 22% to INR 3,918.5 crore in the first half of 2026.
- PhonePe leads the UPI market with a 46.2% share of total UPI transaction volume.
- The company reported an adjusted profit of ₹630 crore after excluding non-cash employee stock ownership plan (ESOP) expenses.
- PhonePe reached 700 million (70 crore) registered users globally on April 29, 2026.
- NPCI reported that UPI recorded a record 21.7 billion transactions worth INR 28.33 lakh crore in January 2026.
- As of April 28, 2026, PhonePe crossed 50 million lifetime registered merchants.
- The majority of PhonePe users, about 39.3%, spend less than USD 10,000 annually on the app.
- PhonePe and Google Pay together hold a combined market share of 79% in May 2026.
- Computers, Electronics & Telecommunication is the leading named vertical, representing 10.16% of total usage.
- Around 65%-70% of PhonePe’s monthly active users (MAUs) are aged 18–34.
- Users aged 18-24 years (30%) mainly use PhonePe for peer-to-peer (P2P) transfers, mobile recharges, food delivery, and daily payments.
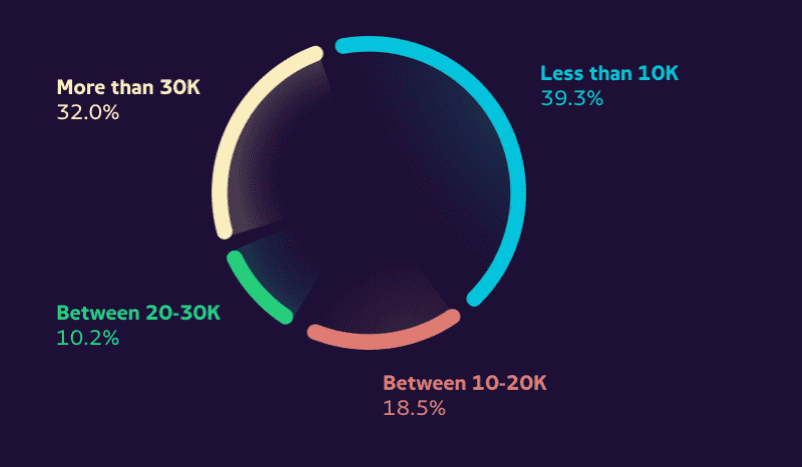
PhonePe App Statistics by Typical User Spending Breakdown
(Source: phonepe.com)
- The majority of PhonePe users, about 39.3%, spend less than USD 10,000 annually on the app.
- Around 18.5% of users fall in the USD 10,000-20,000 spending range.
- A smaller share of users, 10.2%, spend between USD 20,000 and USD 30,000.
- Notably, 32.0% of users spend more than USD 30,000.
PhonePe Growth in Daily Transactions
- According to Coin Law, PhonePe processes over 330 million transactions daily.
- The platform’s annualized Total Payment Value exceeds INR 150 lakh crore.
- In April 2026, UPI transactions on PhonePe reached INR 14.31 lakh crore.
PhonePe User Base Trends
(Source: coinlaw.io)
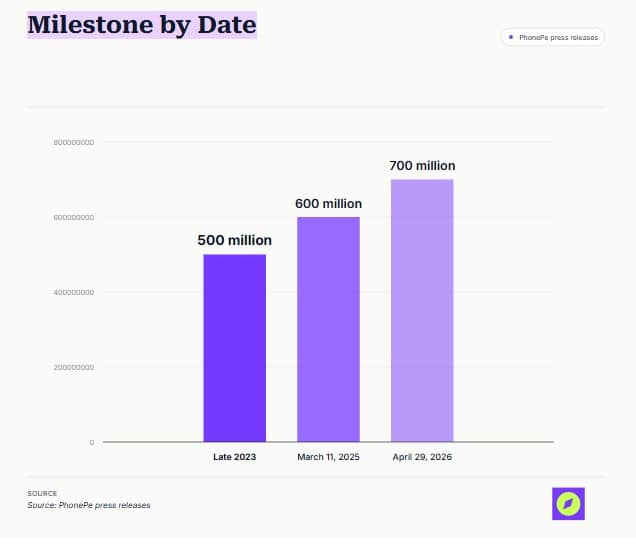
- PhonePe reached 700 million (70 crore) registered users globally on April 29, 2026.
- The platform took 136 days to gain its first 1 million users, but now adds 1 million users every 6 days.
- From 2023 to 2025, PhonePe recorded a 56.25% CAGR, reflecting steady growth.
- As of April 28, 2026, PhonePe crossed 50 million lifetime registered merchants.
- The company now serves merchants across 98% of India’s postal codes.
- PhonePe recorded 140 million daily active users as it approached its planned public listing.
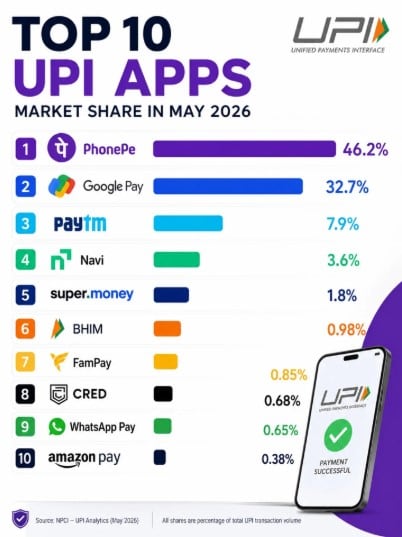
Top 10 UPI Apps by Market Share
(Source: instagram.com)
- PhonePe leads the UPI market with a 46.2% share of total UPI transaction volume, making it the dominant player by a wide margin.
- Google Pay ranks second at 32.7%, followed by Paytm at 3rd with 7.9%.
- Navi ranks fourth with 3.6%, while super. money captures 1.8% of the market.
- The remaining apps are BHIM (0.98%), FamPay (0.85%), CRED (0.68%), WhatsApp Pay (0.65%), and Amazon Pay (0.38%).
UPI Market Share Trends, Winners and Losers
(Source: i0.wp.com)
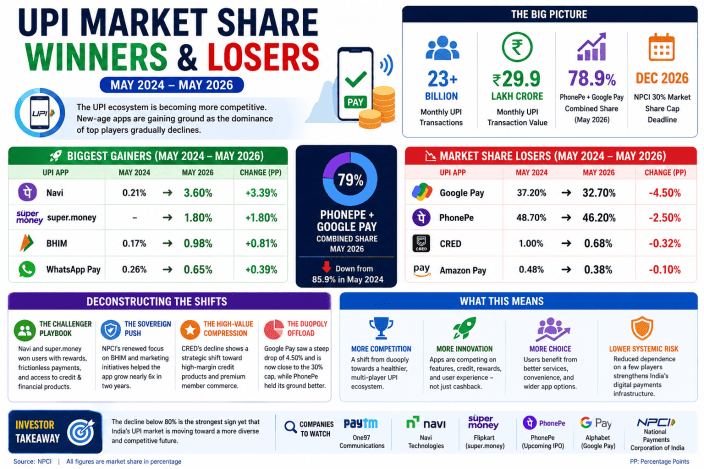
- The UPI ecosystem recorded 23+ billion monthly transactions with a total transaction value of ₹29.9 lakh crore.
- PhonePe and Google Pay together hold a combined market share of 79% in May 2026, down from 85.9% in May 2024.
- Among the biggest gainers, Navi surged from 0.21% to 3.60% (+3.39%), super. Money entered with 1.80% (+1.80%), BHIM grew to 0.98% (+0.81%), and WhatsApp Pay rose to 0.65% (+0.39%).
- On the losing side, Google Pay declined from 37.20% to 32.70% (-4.50%), PhonePe fell from 48.70% to 46.20% (-2.50%), CRED dropped to 0.68% (-0.32%), and Amazon Pay slipped to 0.38% (-0.10%).
- The NPCI’s 30% market share cap deadline is set for December 2026.
Top Industry Verticals Using PhonePe
(Reference: similartech.com)
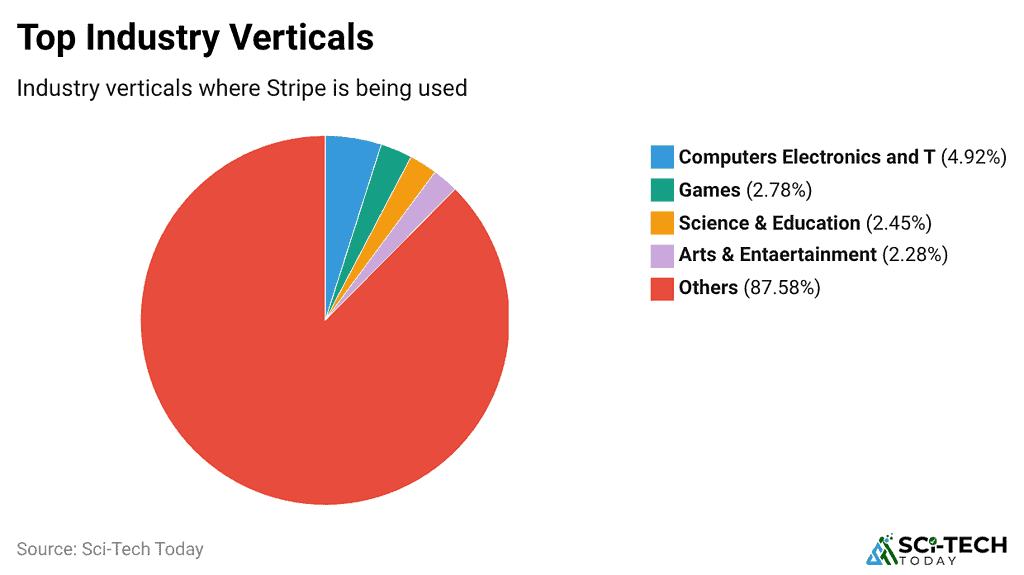
- Computers, Electronics & Telecommunication is the leading named vertical, representing 10.16% of total usage.
- Finance follows as the second-largest named sector, contributing 6.89% of industry usage.
- Lifestyle and Gambling hold smaller shares at 2.28% and 2.01%, respectively.
- The other category accounts for the largest share of PhonePe usage at 78.66%.
Top Websites Using PhonePe
| Website URL | Monthly Visits (Estimated) | Role |
| amazon.in | 105.2 million | UPI/PhonePe accepted at checkout |
| flipkart.com | 93.8 million | Native PhonePe integration (Walmart-backed sibling) |
| myntra.com | 14.3 million | PhonePe accepted; 5% rewards with PhonePe HDFC card |
| meesho.com | 13.8 million | UPI/PhonePe accepted at checkout |
| nykaa.com | 3.7 million | PhonePe PG integrated |
| bigbasket.com | 2.5 million | PhonePe UPI accepted |
| jiomart.com | 2.3 million | UPI/PhonePe accepted |
| firstcry.com | 1.7 million | PhonePe accepted |
| lenskart.com | 895 thousand | PhonePe UPI accepted |
| tatacliq.com | 849 thousand | PhonePe PG integrated |
| pepperfry.com | 476 thousand | PhonePe UPI accepted |
| snapdeal.com | 457 thousand | PhonePe accepted |
Usage By Websites Across the Globe
| Country | Websites |
| India | 2,238 |
| United States | 247 |
| United Kingdom | 55 |
| Pakistan | 36 |
| Brazil | 31 |
| France | 28 |
| Russia | 28 |
| Germany | 26 |
| China | 24 |
| Canada | 23 |
| Rest of the world | 552 |
(Source: similartech.com)
The data in the given table shows the usage of PhonePe’s website across the world. The PhonePe statistics show that India ranks at the top with the usage of 2,238 websites, followed by the United States and the United Kingdom.
PhonePe Revenue Growth Reports
- According to Money Control, PhonePe’s revenue from operations increased 22% to INR 3,918.5 crore in the first half of 2026.
- Net loss widened to INR 1,444.4 crore for the 6 months ended September 30, 2025, from INR 1,203.2 crore for the same period a year earlier.
- The company recorded an exceptional gain of INR 434.5 crore from the sale of a 5% stake in MapmyIndia.
- The stake was sold for INR 480.9 crore in June.
- Operating revenue grew 22.2% to INR 3,918.5 crore in H1 2026, up from INR 3,207.5 crore a year earlier.
- Payment services remained the largest revenue contributor, generating INR 3,231.7 crore, up 10.2% from INR 2,932.25 crore in the previous year.
PhonePe Profitability and Merchant Network
- Its merchant acceptance network covers over 98% of India’s postal codes. Additionally, paid search traffic has risen by 4.31% relative to current levels.
- PhonePe reached an important milestone toward profitability in FY25.
- The company reported an adjusted profit of ₹630 crore after excluding non-cash employee stock ownership plan (ESOP) expenses.
- Its reported net loss was ₹1,727 crore, improving from ₹1,996 crore in FY24, mainly because ESOP costs are included in statutory results.
- Adjusted EBITDA increased to ₹1,477 crore, showing stronger operating performance.
- PhonePe also recorded 140 million daily active users as it prepared for a potential IPO.
- PhonePe had over 50 million registered merchants as of 28 April 2026, up from more than 40 million in March 2025.
Proximity Mobile Payment Users
(Source: eMarketer.com)
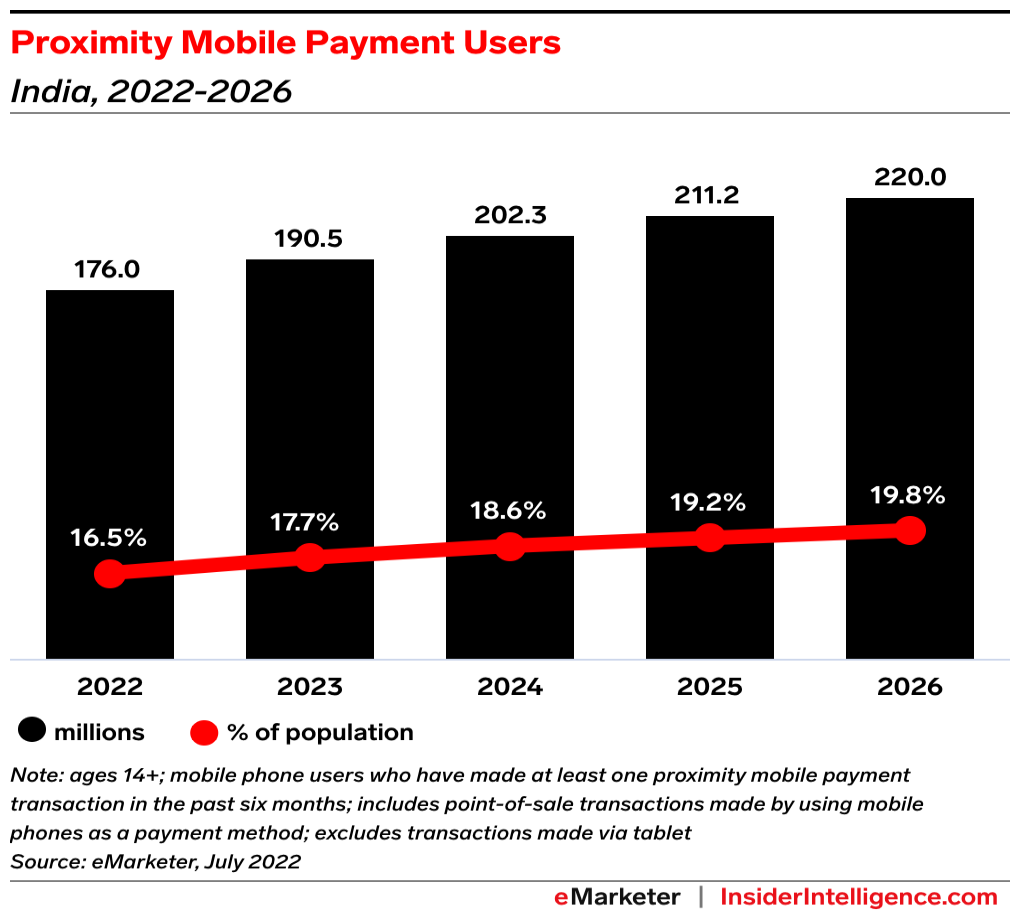
The graph displays the number of proximity mobile payment users in India for the period between 2022 and 2026. The graph also shows a steady increase in both the number of users and the percentage of the population using proximity mobile payments. By 2026, it is estimated that there will be 220.0 million users, comprising 19.8% of the population.
PhonePe User Demographics by Age Profile
- Around 65%-70% of PhonePe’s monthly active users (MAUs) are aged 18–34.
- Users aged 18-24 years (30%) mainly use PhonePe for peer-to-peer (P2P) transfers, mobile recharges, food delivery, and daily payments.
- The 25-34-year-old segment (approximately 40%) uses the app for shopping, investments, systematic investment plans (SIPs), and routine financial transactions.
- Users aged 35-44 years (around 20%) mainly use PhonePe for bill payments, insurance, and merchant payments, while those aged 45+ years (10%) primarily use it for utility bill payments.
- PhonePe has relatively higher adoption among users aged 26+, while users aged 18-25 prefer Google Pay.
- UPI adoption remains high across age groups, ranging from 71% among users under 25 to 83% among those aged 24-34.
By Gender Profile
- Male users account for around 60% of MAUs, while female users reached nearly 40% by 2025, outperforming the national digital payments average of 25% women users.
- Women mainly use PhonePe for utility bill payments, digital gold, AutoPay, and SIPs.
- 33% of women use UPI regularly, with 51% reporting connectivity issues and 30% citing security concerns.
- Support for 11 Indian languages has improved adoption in Tier 2, Tier 3, and rural markets.
By Income Profile
- PhonePe serves users across all income levels: 20% earn below USD 5,000 annually, 50% earn USD 5,000-20,000 annually, and 30% earn above USD 20,000 annually.
- Middle-income users are the most active, using PhonePe for shopping, insurance, investments, SIPs, and bill payments.
- UPI adoption is 74% among users earning below ₹5 lakh, over 90% among those earning ₹10-15 lakh annually, and around 82% among those earning above ₹20 lakh annually.
PhonePe vs Paytm – Financial Face-Off
(Source: economictimes.indiatimes.com)
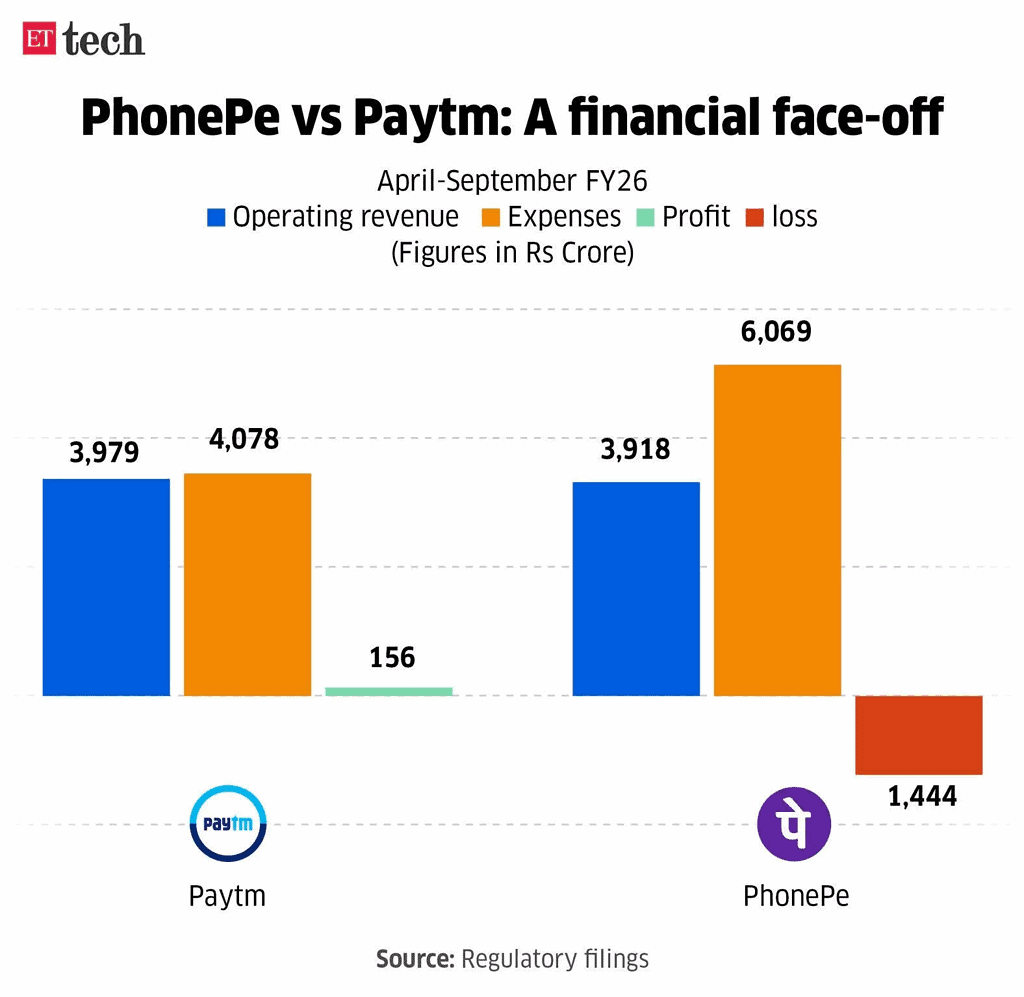
- Paytm reported operating revenue of Rs 3,979 crore against expenses of Rs 4,078 crore, yet still posted a profit of Rs 156 crore during the period.
- PhonePe, despite generating a higher operating revenue of Rs 3,918 crore, recorded significantly higher expenses of Rs 6,069 crore, resulting in a net loss of Rs 1,444 crore.
Recent Developments of PhonePe
- According to the National Payments Corporation of India, PhonePe’s UPI market share increased from 46.70% in March 2026 to 47.07% in April 2026.
- PhonePe crossed 700 million registered users on April 29, 2026, reflecting strong customer growth.
- On April 28, 2026, the company reached 50 million registered merchants across India.
- NPCI reported that UPI recorded a record 21.7 billion transactions worth INR 28.33 lakh crore in January 2026.
- As per filings with the Registrar of Companies, PhonePe reported revenue of INR 7,115 crore for 2025, ahead of its planned public listing.
- Payment services contributed 88.55% of the company’s total operating revenue.
Ending
PhonePe has shown impressive growth and strong financial performance, as highlighted by PhonePe statistics. Significant investments in advertising, technology, and diverse services, such as gold purchases, drive the company’s success. With a substantial market share and high transaction volume, PhonePe has become a leader in India’s digital payments sector.
The platform’s broad usage across various regions and demographics reflects its wide appeal and strong market position. PhonePe statistics confirm its ongoing expansion and influence in the financial services industry.
FAQ
The maximum daily UPI transaction limit on PhonePe is ₹1 lakh.
PhonePe is free for most users, though certain services and products may incur charges.
PhonePe faces intense competition, depends heavily on UPI transactions, has a limited international presence, and continues to report statutory losses despite growth

Sources


