





Introduction
Blockchain Statistics: Blockchain refers to the growing list of records accumulated with the help of cryptographic hashes. The basic concept,, based on cryptocurrency, deals with securing a compiled list of data and its nodes. Blockchain nodes are recorded, meaning that they cannot be edited retroactively once the data is stored.
Decentralization and peer-to-peer networks are the primary basis of blockchain, ensuring that data is shared on a P2P (peer-to-peer) basis. Based on blockchain statistics, let’s go through various technological developments in the field.
Editor’s Choice
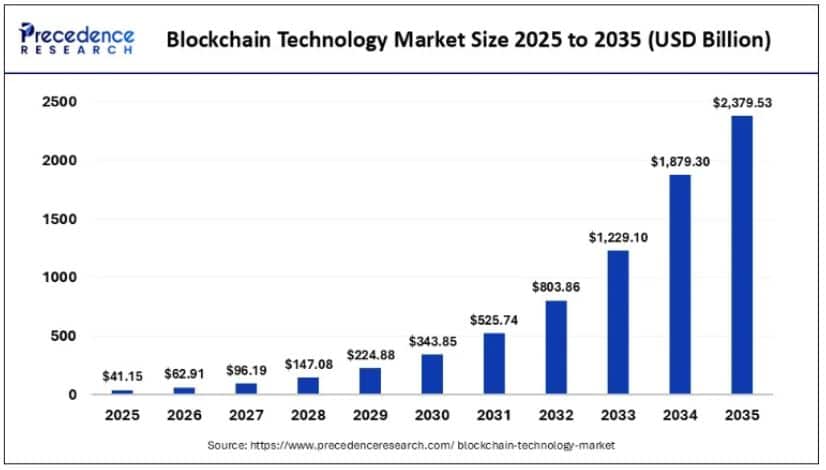
- The worldwide blockchain technology market is expected to rise from about $41.14 billion in 2025 to roughly $2.38 trillion by 2035 with 50.04% CAGR.
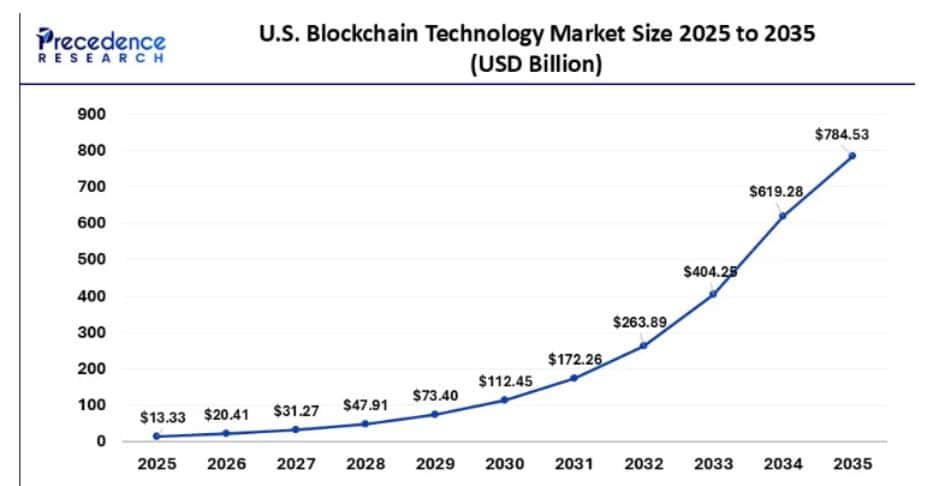
- U.S. blockchain space is forecasted to rise from $13.33 billion in 2025 up to $784.53 billion by 2035, with a 50.27% CAGR.
- North America holds 46% of the global blockchain market, then Europe is at 28%, and Asia-Pacific at 20%.
- Banking takes about 29.7% of global blockchain spending.
- In blockchain spending, the U.S. is also leading at $4.2 billion, and Western Europe follows with $2.9 billion.
- On June 23, 2026, Bitcoin handled 862,979 transactions.
- In June 2026, Bitcoin averaged 651,655 transactions per day, showing a 90% jump compared to June 2025.
- 60% of users apply blockchain for international money transfers, while 20% use it for KYC and AML workflows.
- Blockchain business value added is projected to surpass $360 billion by 2026, and then reach about $3.1 trillion by 2030.
Blockchain Origins
- The concept of Blockchain emerged during the 1970s when computer scientist Ralph used Hash trees to store data by linking blocks based on cryptography.
- By the 1990s, these blocks used a system that documented timestamps that could not be tampered with.
- In 2008, in Japan, Satoshi Nakamoto refined the blockchain to modern standards and used 1MB blockchain blocks to document transactions involving bitcoins.
- Many of the core features of blockchain are ironclad and are currently used as the standard for transactions.
Furthermore, based on Blockchain statistics, the technology of Blockchain in cryptocurrency can be categorized into three generations.
- 1st Generation – Using 1MB blockchain-based information for Bitcoin transactions.
- 2nd Generation – Relatively newly developed currencies, such as Ethereum, use blockchain technology for asset transfer-based transactions.
- 3rd Generation – By resolving limitations of scale related to computation, there are potential opportunities available that are not bound by limits in future blockchain developments.
Blockchain Technology Market Growth
(Source: precedenceresearch.com)
- Blockchain is shifting from a niche technology into the largest global digital infrastructure market.
- According to Precedence Research, the market size is USD 41.14 billion in 2025, then it jumps to USD 62.91 billion in 2026, and by 2035 it is forecasted to reach around USD 2,379.53 billion. That’s an outstanding 50.04% CAGR for 2026–2035, so the scale here looks massive.
- Overall, the figures indicate that the blockchain could see one of the strongest, longer-term growth paths among the emerging digital technologies, which may open meaningful opportunities for firms, investors, and tech providers.
U.S. Blockchain Technology Market
(Source: precedenceresearch.com)
- The U.S. blockchain technology market’s expansion curve keeps getting steeper through 2035.
- As per Precedence Research reports that the market starts at USD 13.33 billion in 2025, rises to USD 20.41 billion in 2026, then USD 31.27 billion in 2027, and USD 47.91 billion in 2028.
- The market reaches USD 73.40 billion in 2029, followed by USD 112.45 billion in 2030.
- The expectation puts the market at USD 172.26 billion in 2031, USD 263.89 billion in 2032, and USD 404.25 billion in 2033.
- This market will keep climbing to USD 619.28 billion in 2034, before reaching USD 784.53 billion in 2035, with a projected CAGR of 50.27%.
- In other words, the path goes from double-digit billions into triple-digit territory by 2030.
Perception of Cryptocurrency in Society
(Source: go.chainalysis.com)
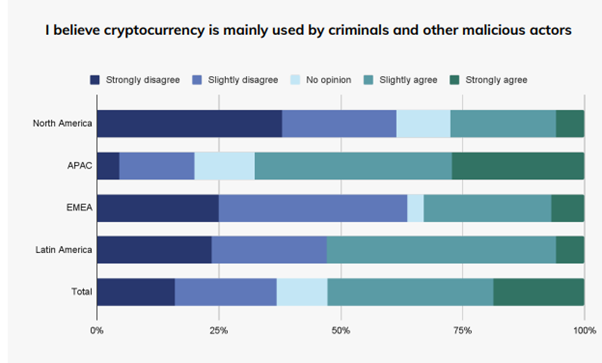
According to Blockchain statistics, the following information can be inferred.
- More than 40% of North Americans disagree that cryptocurrencies that are powered by blockchain are used for unethical/illegal activities.
- While approx. 30% of APAC countries strongly agree that cryptocurrencies are used for illegal and unethical activities.
- If total activities are looked at, approximately 30% of the world slightly agree and has the perception that cryptocurrencies are misused.
(Source: go.chainalysis.com)
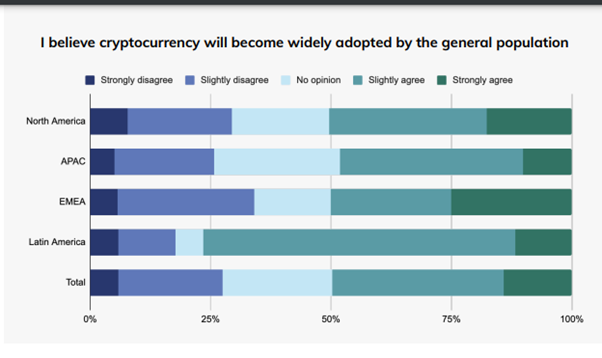
If we look at the future perception of cryptocurrencies as per Blockchain statistics, the following can be inferred:
- The basic consensus is that cryptocurrency will remain the future mode of currency transaction.
- Latin America has the most positive outlook for cryptocurrency, which could be attributed to the fact that El Salvador was the first country to adopt Bitcoin as legal tender.
- Relatively, North America has the highest disagreement, which is based on the fact that the United States dollar is its primary currency, and it is likely to remain its most used legal mode of financial transaction.
(Source: go.chainalysis.com)
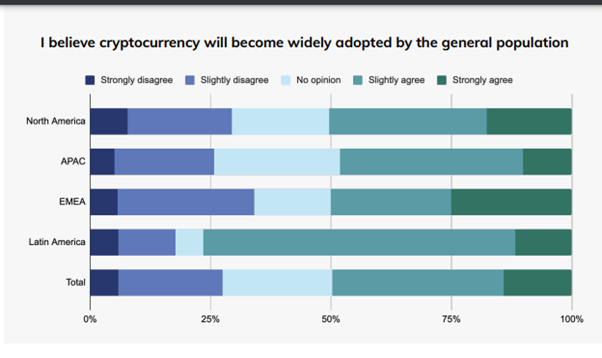
If we look at the future perception of cryptocurrencies as per Blockchain statistics, the following can be inferred:
- The basic consensus is that cryptocurrency will remain the future mode of currency transaction.
- Latin America has the most positive outlook for cryptocurrency, which could be attributed to the fact that El Salvador was the first country to adopt Bitcoin as legal tender.
- Relatively, North America has the highest disagreement, which is based on the fact that the United States dollar is its primary currency, and it is likely to remain its most used legal mode of financial transaction.
(Source: go.chainalysis.com)
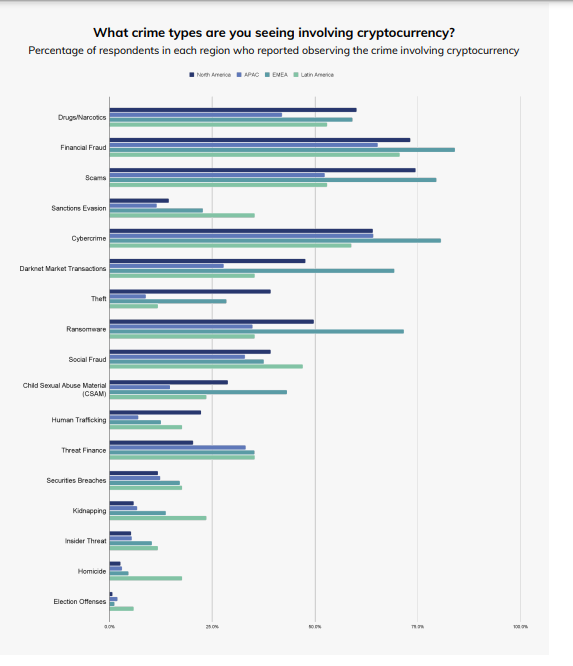
Based on Blockchain statistics, the following crimes are the most witnessed involving blockchain-based cryptocurrency.
- A majority of population-based transactions with more than 50% in North America, EMEA, and Latin America.
- Likewise, financial fraud is considered the biggest issue with cryptocurrency.
- Currently, election expenses are considered the least concerning issue.
Blockchain Users Discover New Projects Via Social Media
(Source: amraandelma.com)
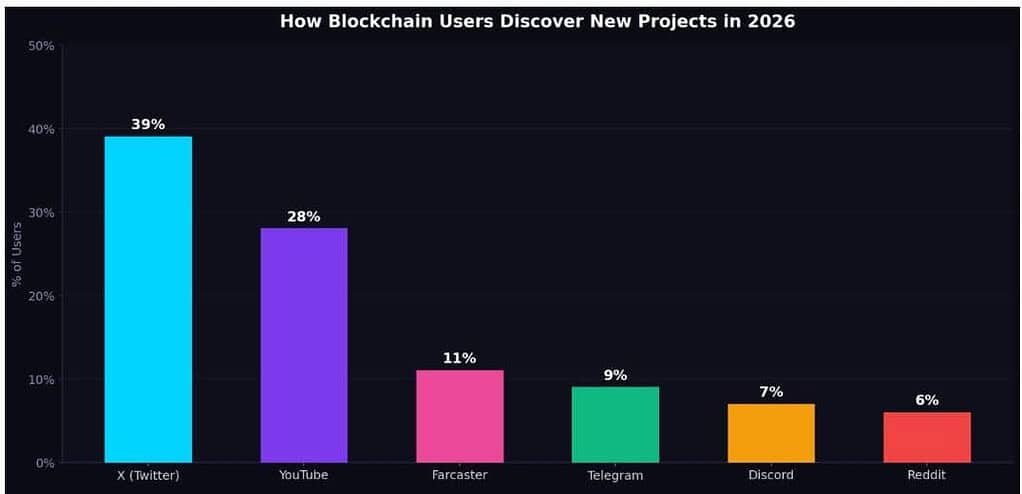
- The above chart is showing the Social media has become a very powerful gateway for stumbling upon blockchain projects. The different social media platforms are increasingly deciding where people first spot new chances and information.
- In a CoinGecko survey with 12,400 respondents, X (Twitter) landed at 39% for first-touch blockchain project discoveries in 2026.
- YouTube came in at 28% too, which points to how much video-based education and content is mattering more and more.
- Furthermore, Farcaster’s share jumped from 2% to 11% year over year, hinting at fast momentum for decentralized social spaces.
- The discovery growth suggests that online attention is really central to blockchain discovery, since 82% say they feel social media influence is on that same scale.
- Overall, the bigger pattern looks like blockchain marketing is moving away from only chasing reach, and more toward cultivating trust, credibility, and consistency.
- Social platforms are not just places to promote things, and they’re increasingly shaping how blockchain projects get noticed and how user interest shows up.
Active Blockchain Developers
(Source: binance.com)
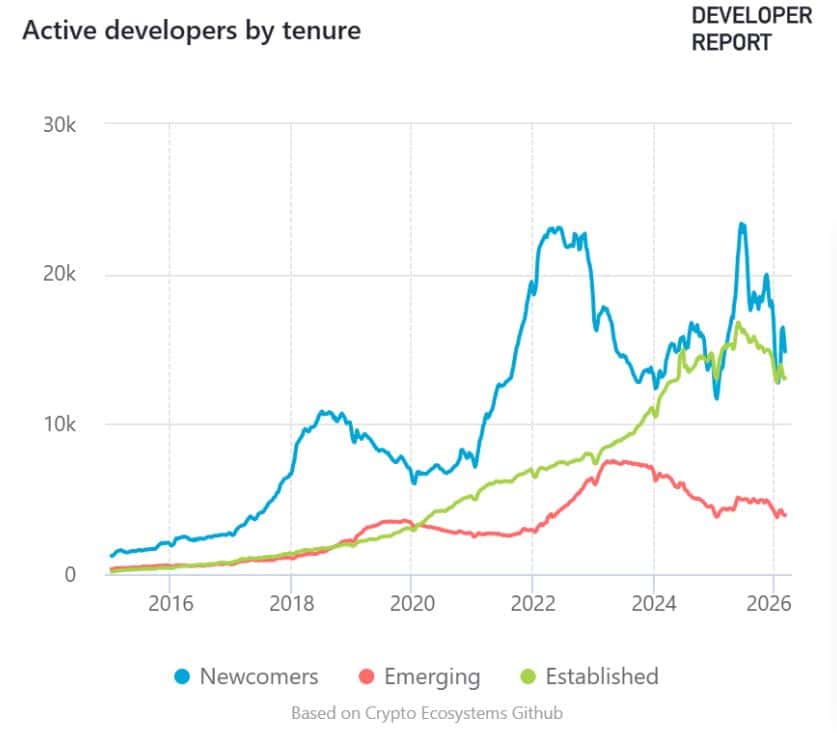
- For artificial intelligence, which is pulling in more technical talent and a lot more attention too, blockchain is dealing with a real developer headache in early 2026.
- According to Electric Capital, monthly active developers working on crypto projects have declined to their lowest point since 2022, and overall blockchain developer activity is declining by around 75%.
- Ethereum’s weekly active developer total slid 33% across just three months, and Solana lost about 40% of its developers.
- Base, which is an Ethereum Layer-2 setup, saw a 52% decrease, and Aptos had an approximately 60% fall.
- The most dramatic shrinking happened on BNB Chain, where developer activity dropped around 85%. Celo also posted something like a 52% reduction.
- The recent statistical figures painted a clear picture of a change in where developers decide to spend their energy and skills.
- AI’s fast growth is basically generating a stronger need for engineers and open-source contributors, so competition for blockchain talent is getting tighter.
- Crypto ecosystems need to push harder on developer perks, funding, and innovation pathways.
- If the Crypto ecosystem doesn’t move to ongoing migration of talent toward AI could end up slowing blockchain’s pace for building new applications and keeping that long-run technological momentum.
(Reference: enterpriseappstoday.com)
(Reference: enterpriseappstoday.com)
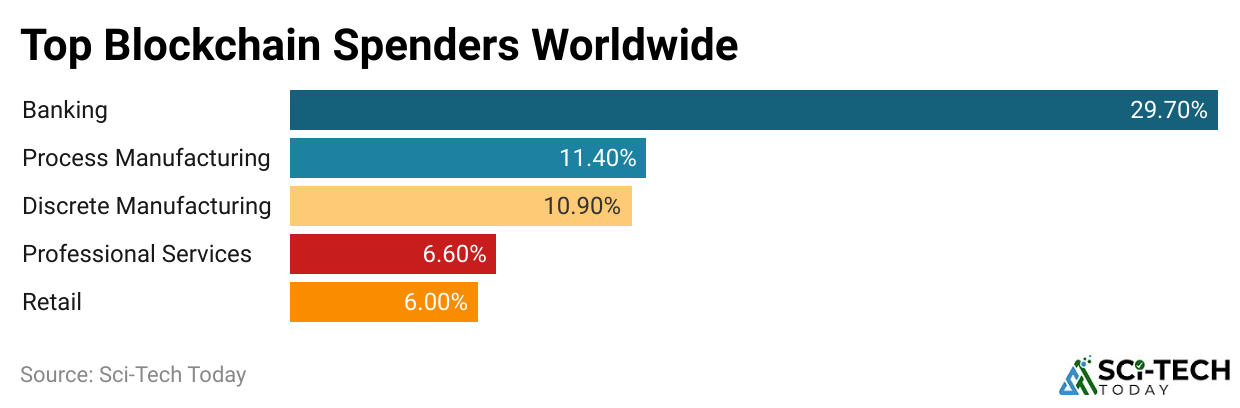
Based on Blockchain statistics, the following inferences are estimated. The following conclusions may be drawn from the above charts about global blockchain spenders:
Global Blockchain Spending Leaders.
- Banking accounted for 29.70% of all blockchain spending, making it the most prominent industry.
- Process Manufacturing accounts for 11.40% of all blockchain spending, making it the second-largest industry.
- Discrete Manufacturing is next in line, accounting for 10.90% of the expenditure.
- Expert Services account for 6.60% of blockchain investments.
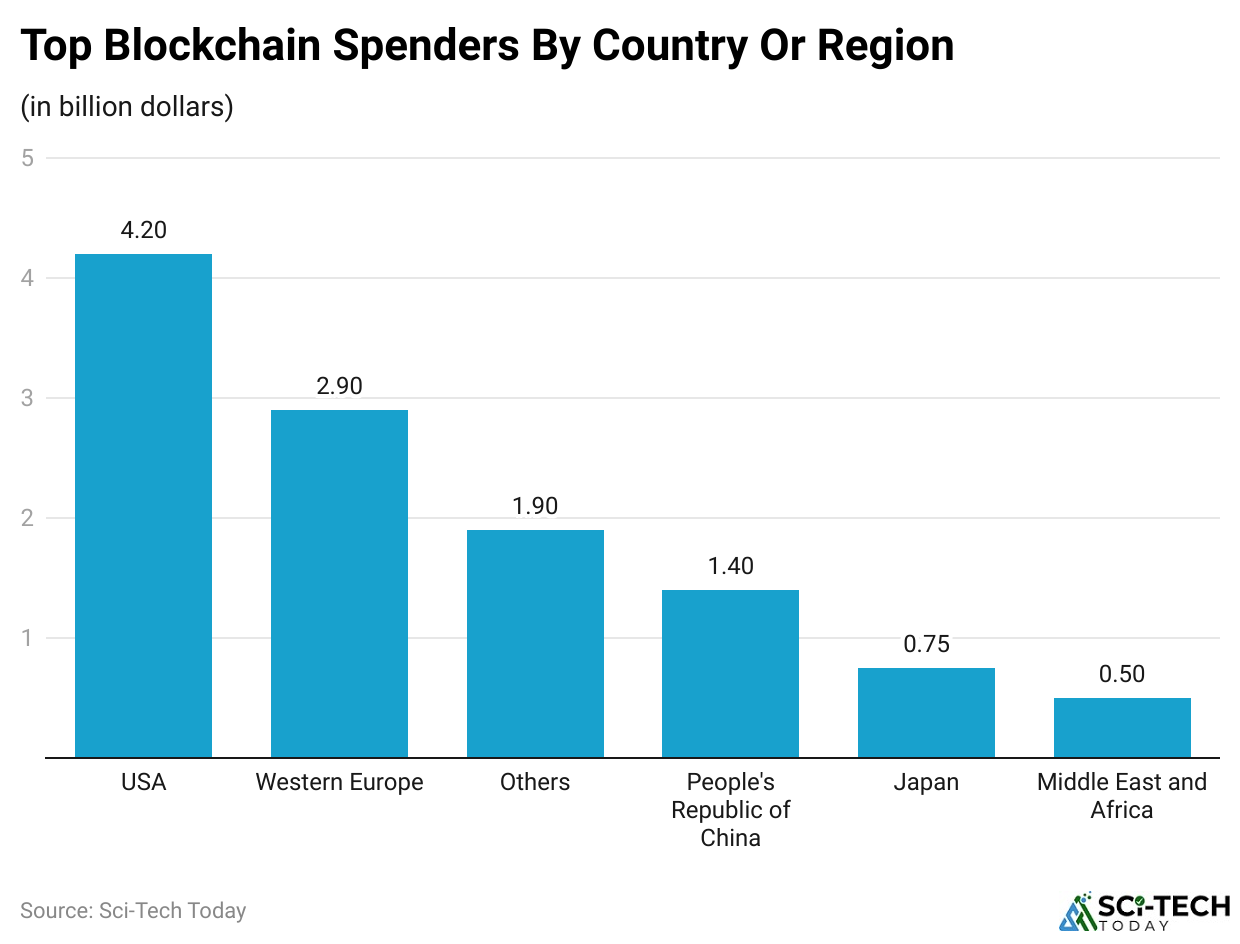
- Of the significant categories, Retail has the lowest proportion, accounting for 6.00% of the total spend. The USA is the most prominent blockchain spender by country or region, spending $4.2 billion. Western Europe comes in second, having spent $2.90 billion.
- Others (unspecified regions) have spent $1.90 billion altogether.
- With $1.40 billion, the People’s Republic of China comes next.
- Blockchain costs Japan $0.75 billion.
- With $0.50 billion, the Middle East and Africa region has the lowest spending of all the mentioned regions.
General Insights: Regarding blockchain investments, banking leads the field by a wide margin. The USA leads the world in blockchain expenditure by a vast percentage above other areas.
- Notable blockchain investments are also made in Western Europe and other locations that are not included.
- Blockchain expenditure is somewhat lower in the Middle East, Africa, Japan, and the People’s Republic of China.
Bitcoin Transactions in 2026
(Source: bitcoin.com)
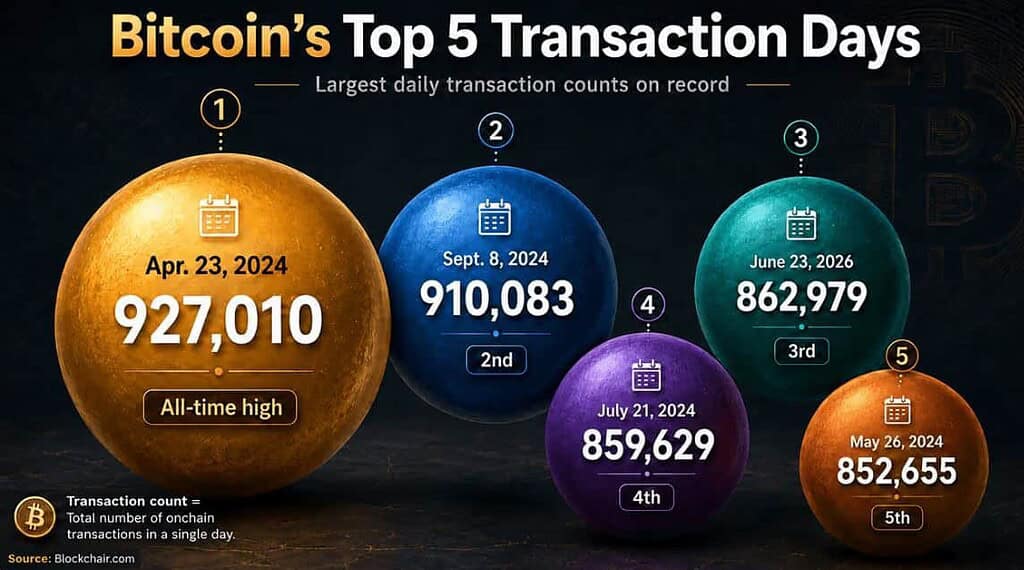
- In 2026, Bitcoin’s on-chain activity is becoming stronger again, as transaction volumes are kicking back toward those historical benchmarks.
- According to Blockchair, on June 23, 2026, Bitcoin processed 862,979 transactions, and that puts the day as the third busiest since the network started back in January 2009.
- The top transaction mark is still 927,010 transactions on April 23, 2024, then 910,083 on September 8, 2024.
- For June 2026, it averaged 651,655 transactions per day, which is about a 90% lift compared with June 2025’s 342,866 daily average.
- The daily average Bitcoin transactions went from 390,877 in January to 468,602 in February, 475,075 in March, 560,212 in April, 645,363 in May, and 651,655 in June.
- From January through June, the monthly average climbed 66.7%, while the median rose 64.2%.
- By July 5, 2026, Bitcoin had reached a median daily transaction count of 529,623 and an average of 533,890, both already higher than the full-year totals for 2024 and 2025. Over those 186 days, the network tallied 99.3 million transactions.
- In 2024, 51 days cleared 700,000 transactions, but in 2025, not a single day came close to the 2024 peak levels.
- The steady increase from month to month in Bitcoin transactions indicates the renewed utilization of the network across everyday users, institutions, exchange operators, and others.
Blockchain Development Cost
| Project type | Build cost range (USD) | Time frame |
| Basic token (standard template) | 5,000–20,000 | 1–3 weeks |
| NFT collection | 10,000–40,000 | 2–6 weeks |
| Token + simple dApp (MVP) | 25,000–60,000 | 2–4 months |
| DeFi MVP (staking, simple DEX) | 40,000–100,000 | 3–5 months |
| NFT marketplace | 50,000–150,000 | 3–6+ months |
| Wallet (single/limited multi-chain) | 30,000–120,000 | 3–6+ months |
| Advanced DeFi protocol | 150,000–400,000+ | 6–9+ months |
| Enterprise blockchain solution | 120,000–300,000+ | 6–12+ months |
Blockchain Overview
Blockchain Technology Investment
- Investment in blockchain technology has been moving steadily up on an upward trajectory.
- For scalable growth, venture capital, for its part, is putting more money behind blockchain infrastructure that’s supposed to help decentralized applications run faster and safer.
- The funding is leaning toward Layer 1 and Layer 2 solutions, zero-knowledge technology, and the broader blockchain infrastructure stack too.
- According to Fortune Business Insights, in March 2025, DoubleZero Foundation raised USD 28 million in a funding round led by Multicoin Capital and Dragonfly.
- The investment funding kind of signals that investors still trust infrastructure that can improve blockchain performance and help it get adopted more widely.
Blockchain Industry Adoption
- BFSI is expected to hold 23.52% of the blockchain market in 2026, which basically highlights how much the financial sector depends on blockchain for secure, transparent, and quick transactions.
- Deloitte report states that 60% of users use blockchain for international money transfers, while 20% apply it to KYC and AML processes; now, it is becoming more important for compliance and cross-border payments.
- On another note, energy & utilities is projected to post the fastest CAGR of 47.91% over the forecast period.
- Blockchain can support decentralized, peer-to-peer energy trading, and that could speed up adoption by letting consumers generate renewable power and then exchange it more directly.
Regional Blockchain Developments
- In 2025, the global blockchain technology market shows that the clear regional leader, which is North America.
- North America is leading with 46% of the share, which shows stronger adoption, steady investment, and a solid technology backbone.
- After that, Europe sits at 28%, showing a deep-rooted blockchain ecosystem.
- Asia Pacific comes in with 20%, which is rapidly expanding its presence, plus take-up for blockchain solutions in general at a higher level.
- Latin America is at 4%; it has a smaller share but is still clearly emerging.
- The Middle East and Africa (MEA) adds up to 2%, making it the lowest regional slice of the share.
- Overall, North America and Europe together control 74% of the market, while Asia Pacific is still the one with major upside for blockchain industry growth.
Blockchain in Supply Chain Management
- Supply chain management is one of those key areas where blockchain technology really seems to carry immense potential.
- According to Fortune Business Insights, payments are forecast to be 25.45% of the overall blockchain market by 2026, which lines up with the wider use of digital assets for transactions across travel, online retail, and other sectors.
- Bitcoin and Ethereum continue to matter as payment instruments, and more organizations keep broadening cryptocurrency acceptance.
- Newegg has permitted Bitcoin payments across 73 additional country-specific stores.
- However, the IoT segment is forecasted to land a 46.56% CAGR throughout the forecast window.
- In other words, blockchain may help run automated microtransactions for electricity, bandwidth, and data exchanges, and that can open fresh pathways for connected devices while also supporting blockchain’s longer-term market momentum.
Non-Fungible Tokens (NFTs)
- According to Kraken, the NFT market revolving around the mixed situation.
- About 5% of adults aged 18-34 say they own NFTs worldwide, but it dropped fast as it matured; just 1% of people over 55 have these digital assets.
- In Q2 2024, Blockchain gaming firms still pulled in an impressive $1.1 billion in investment.
Blockchain Recent Developments
- In the current scenario, blockchain is shifting beyond cryptocurrencies, but it is moving into payments, NFTs, AI privacy, plus tokenization, all acting like real growth hooks.
- Ethereum staking withdrawals have already passed 120.68 million ETH in circulation, which also shows the network is still busy.
- On the payments side, 85% of decision-makers expect crypto payments to become normal within five years, so there’s more confidence about mainstream adoption.
- The global NFT market is projected to hit $60.82 billion by 2026, and that includes $2.8 billion in first-half sales.
- AI-for-blockchains market is valued at $843 million in 2026, then forecasted to grow to $3.46 billion by 2034; it is showing up inside blockchain infrastructure.
- The Cross-chain tech bridge development is currently valued at $135 million in 2025 and is expected to reach $430 million by 2032.
- On top of that, 23 nations have tried out or officially started government-issued NFT credentials, and tokenized real estate is estimated at around $78 billion.
- Nowadays, blockchain is turning into a broader digital infrastructure layer; it is not just a side project anymore.
Blockchain’s Future Outlook
- Blockchain is expanding into a wider role across the digital economy, so its influence is expected to go way past cryptocurrency.
- The blockchain business value is projected to be more than $360 billion by 2026, and is expected to hit over $3.1 trillion by 2030.
- In the current scenario, the strongest opportunities are usually flagged in five key places: cybersecurity, government, finance and banking, medical applications, and marketing. These domains can use blockchain because it can help with things like transparency, protection, data management, and faster transaction handling.
- The blending of artificial intelligence with blockchain and virtual reality, it will turn into a digital interaction, where intelligent systems tie into secure digital records and immersive experiences.
- The growth in the blockchain landscape is moving out of being a transition tool and leaning toward becoming broader business infrastructure.
Conclusion
In conclusion, blockchain technology has made significant strides in 2023 and 2024, with substantial market value, investment, and adoption growth across various industries. The global blockchain market is expected to reach $17.5 billion US dollars by 2024, driven by increased investment, expanding use cases, and favorable regulatory developments.
As a market researcher, it is essential to monitor these trends and provide insights into the evolving landscape of blockchain technology. The financial sector remains the largest adopter, while other industries, such as healthcare, supply chain management, and public services, increasingly recognize blockchain’s benefits. With continued innovation and regulatory clarity, blockchain technology is poised to revolutionize numerous aspects of our digital economy.
This comprehensive analysis of blockchain statistics for 2023 and 2024 highlights this transformative technology’s remarkable growth and potential, offering valuable insights for stakeholders and decision-makers in the blockchain ecosystem.
FAQ
It’s kind of projected that the global blockchain technology market could reach around $2.38 trillion by 2035, starting from $41.14 billion in 2025.
North America seems to be in front at about 46% of the global market share, then Europe comes after that with roughly 28%.
Banking is the biggest spender, making up approximately 29.7% of worldwide blockchain spending.
In June 2026, Bitcoin averaged 651,655 transactions per day, and that number is up 90% year over year.
The big uses usually include payments, finance, supply chains, cybersecurity, digital identity, healthcare, government services, NFTs, plus tokenization, and that’s basically the usual set of topics.