









Quick Verdict
HPE posted record fiscal Q3 2026 non-GAAP EPS of $1.11 and revenue of $12.2 billion, beating consensus estimates of roughly $0.92 and $11.93 billion. Revenue rose 34% year over year, but shares fell 4.07% in after-hours trading as investors weighed future margin pressure and AI-backlog conversion risks.
About Hewlett Packard Enterprise
Hewlett Packard Enterprise Company (NYSE: HPE) is an enterprise technology company headquartered in Houston, Texas. Founded in 2015 following the separation of the former Hewlett-Packard Co., HPE supplies enterprise networking, servers, storage, cloud platforms, artificial-intelligence infrastructure, and financing services. Its strategy centers on combining AI, cloud, and networking infrastructure, including HPE GreenLake cloud services and its expanded networking portfolio following the Juniper Networks acquisition.
For fiscal Q3 2026, ended July 31, HPE reported a sharp acceleration in demand across AI systems and networking. The company’s financial performance reflected both stronger high-value infrastructure mix and expanded scale: GAAP gross margin reached 40.1%, while non-GAAP gross margin rose to 40.4%. HPE ended the quarter with $6.216 billion in cash and cash equivalents, compared with $5.773 billion at fiscal 2025 year-end.
Top Financial Highlights
- Total revenue reached $12.213 billion, up 33.7% year over year from $9.136 billion and up 14.4% sequentially.
- GAAP net earnings attributable to HPE rose to $1.540 billion, versus $305 million in the prior-year quarter.
- GAAP diluted EPS was $1.06, up from $0.21 a year earlier; non-GAAP diluted EPS was a record $1.11, versus $0.44.
- GAAP gross margin was 40.1%, expanding 1,090 basis points year over year; non-GAAP gross margin was 40.4%, up 1,050 basis points.
- GAAP operating profit increased to $1.393 billion, compared with $247 million in Q3 fiscal 2025.
- Non-GAAP operating profit was $1.979 billion, up 155% year over year, with a 16.2% operating margin.
- Cash flow from operations totaled $1.641 billion, up from $1.305 billion in the previous-year quarter.
- Free cash flow reached $958 million, compared with $790 million in Q3 fiscal 2025.
- Networking revenue was $2.893 billion, up 74.9% year over year on a reported basis, with a 22.0% operating margin.
- Cloud & AI revenue was $9.042 billion, up 25.4% year over year, while its operating margin improved to 17.0% from 7.0%.
- Server revenue rose 35.3% to $6.766 billion; storage revenue increased 10.2% to $1.291 billion.
- HPE reported $7.6 billion in AI backlog, including $6.8 billion in AI Systems and $0.8 billion in Networks for AI; quarterly AI orders reached $3.1 billion.
- Cash and cash equivalents stood at $6.216 billion as of July 31, 2026; inventory was $11.823 billion, reflecting capacity and product availability needs.
- For fiscal Q4 2026, HPE guided to revenue of $13.9 billion to $14.8 billion and non-GAAP diluted EPS of $1.20 to $1.30.
- For full-year fiscal 2026, HPE raised guidance to revenue growth of 34% to 37%, non-GAAP EPS of $3.75 to $3.85, and free cash flow of at least $3.75 billion.
Beat or Miss?
HPE delivered an earnings and revenue beat relative to the consensus levels cited by market reports. Its reported non-GAAP EPS exceeded consensus by roughly 19 cents per share, while quarterly revenue topped expectations by approximately $270 million.
| Metric | Reported | Difference/Analysis |
| Non-GAAP diluted EPS | $1.11 | Beat consensus estimate of $0.92 by $0.19, or about 20.7% |
| Revenue | $12.2 billion | Beat consensus estimate of $11.93 billion by about $0.27 billion, or roughly 2.3% |
| GAAP diluted EPS | $1.06 | Above HPE’s own outlook range of $0.84–$0.89 |
| Non-GAAP diluted EPS vs. company outlook | $1.11 | Above HPE’s outlook range of $0.88–$0.93 |
| Non-GAAP gross margin | 40.40% | Expanded 1,050 basis points year over year, aided by pricing discipline and favorable mix |
| Free cash flow | $958 million | Highest fiscal-third-quarter free cash flow in company history, according to HPE’s earnings commentary |
HPE’s result was especially notable because it combined revenue growth with material profitability expansion. However, investors appeared focused on the prospect of lower fourth-quarter margins as the revenue mix shifts toward AI systems and on the execution required to convert a substantial backlog into recognized revenue.
Hewlett Packard Enterprise Company And Subsidiaries Segment Information
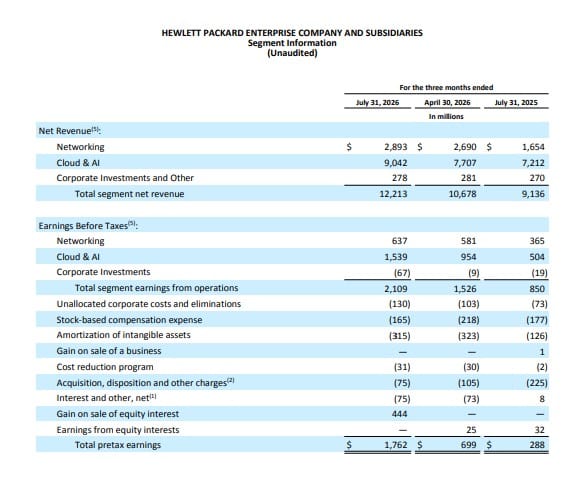
(Source: hpe.com)
- The table presents Hewlett Packard Enterprise Company and Subsidiaries’ unaudited segment information for the three months ended July 31, 2026, compared with April 30, 2026 and July 31, 2025, with figures reported in USD millions.
- HPE generated USD 12,213 million in total segment net revenue in the quarter ended July 31, 2026, increasing from USD 10,678 million in April 2026 and USD 9,136 million in July 2025. The Cloud & AI segment remained the largest revenue contributor, reaching USD 9,042 million, up from USD 7,707 million in the previous quarter and USD 7,212 million a year earlier. Networking revenue increased to USD 2,893 million, compared with USD 2,690 million in April 2026 and USD 1,654 million in July 2025.
- In terms of profitability, total segment earnings from operations reached USD 2,109 million in July 2026, compared with USD 1,526 million in April 2026 and USD 850 million in July 2025. Cloud & AI generated the highest segment earnings at USD 1,539 million, while Networking contributed USD 637 million.
- After accounting for corporate costs, stock-based compensation, amortization of intangible assets, acquisition-related charges, interest expenses, and other items, total pretax earnings stood at USD 1,762 million in July 2026. This was significantly higher than USD 699 million in April 2026 and USD 288 million in July 2025, indicating a strong improvement in HPE’s operating and pretax profitability.
What Leadership Is Saying
“HPE’s strategy is proving itself again this quarter. Our results demonstrate the durability of our profitable growth momentum. We delivered record revenue, orders, and profitability, fueled by surging customer demand across our portfolio. AI is becoming a multi-year growth driver for HPE, and our differentiated portfolio positions us to capture that opportunity at scale.” — Antonio Neri, President and CEO.
“Our outstanding revenue performance and expanded profitability in the third quarter reflect robust demand across our portfolio and consistent, disciplined execution. With our Q3 results and our order backlog at a record level, we are raising our financial outlook and plan to return at least 75% of free cash flow to shareholders in Q4.” — Marie Myers, Executive Vice President and CFO.
Historical Performance
| Category | Q3 Fiscal 2026 | Q3 Fiscal 2025 | Change (%) |
| Revenue | $12.213 billion | $9.136 billion | 33.70% |
| Net earnings attributable to HPE | $1.540 billion | $305 million | 404.90% |
| Earnings from operations | $1.393 billion | $247 million | 463.90% |
| GAAP gross profit | $4.899 billion | $2.672 billion | 83.30% |
| Research and development expense | $1.158 billion | $622 million | 86.20% |
| Selling, general and administrative expense | $1.962 billion | $1.496 billion | 31.20% |
| Total costs and expenses | $10.820 billion | $8.889 billion | 21.70% |
| Operating cash flow | $1.641 billion | $1.305 billion | 25.70% |
| Free cash flow | $958 million | $790 million | 21.30% |
The large increase in GAAP net income partly reflects a $444 million gain on the sale of an equity interest during the quarter. Even excluding this item and other adjustments, HPE’s non-GAAP diluted EPS increased from $0.44 to $1.11, demonstrating substantial underlying operating leverage.
Segment Performance Comparison
The requested “competitor” comparison cannot be constructed from HPE’s earnings release alone because the company does not report competitor financial statements. The most directly comparable disclosure is HPE’s own operating-segment performance, which shows that Networking grew faster on a reported basis, while Cloud & AI remained the company’s largest revenue contributor.
| Category | Q3 Fiscal 2026 | Q3 Fiscal 2025 | Change (%) |
| Networking revenue | $2.893 billion | $1.654 billion | 74.90% |
| Networking operating margin | 22.00% | 22.10% | -0.1 percentage point |
| Cloud & AI revenue | $9.042 billion | $7.212 billion | 25.40% |
| Cloud & AI operating margin | 17.00% | 7.00% | +10.0 percentage points |
| Server revenue | $6.766 billion | $5.000 billion | 35.30% |
| Storage revenue | $1.291 billion | $1.171 billion | 10.20% |
| Campus & Branch revenue | $1.442 billion | $1.101 billion | 31.00% |
| Data Center Networking revenue | $382 million | $180 million | 112.20% |
| Routing revenue | $788 million | $213 million | 270.00% |
The reported 74.9% increase in Networking revenue includes the effect of the Juniper Networks acquisition; the earnings presentation cited 10% normalized Networking growth after adjusting for the acquisition. This distinction is important when assessing HPE’s organic operating momentum.
How the Market Reacted?
HPE shares fell 4.07% in after-hours trading to $49.67 from the regular-session close of $51.83 despite the company’s EPS and revenue beat. The reaction suggests that the market viewed the results as strong but was cautious about future gross-margin and operating-margin trajectory, supply constraints affecting DDR5, DDR4, NAND, and wafer availability, and the timing of converting AI backlog into revenue. HPE’s raised FY2026 and FY2027 outlook remained a constructive signal, but the near-term stock response indicated heightened investor expectations following the quarter’s record results.



