









Quick Verdict
These results are part of the latest Lululemon Athletica Inc. Q2 Fiscal 2026 Earnings release. Lululemon reported Q2 fiscal 2026 diluted EPS of $2.92 and revenue of $2.42 billion. EPS exceeded consensus, but a $0.86-per-share tariff-refund benefit materially supported the result, while revenue missed expectations and guidance was reduced. Shares fell sharply in after-hours trading, reflecting concern over declining comparable sales and North American demand.
About lululemon athletica inc.
lululemon athletica inc. (NASDAQ: LULU) is a Vancouver, British Columbia-based technical athletic apparel, footwear, and accessories company. It designs products for yoga, running, training, and everyday active use, selling primarily through company-operated stores, e-commerce, wholesale, and selected franchise/licensing arrangements. The company was founded in 1998 and had expanded its company-operated retail estate to 825 stores at the end of Q2 fiscal 2026.
Based on LULU’s approximately $121.77 regular-session closing share price immediately before the release and roughly 112.9 million diluted shares outstanding in the quarter, its implied pre-release market capitalization was about $13.7 billion. This is an estimate, not a company-reported market-cap figure. lululemon does not pay a regular cash dividend; investors’ returns have historically depended on growth, operating performance, and buybacks. In Q2, it repurchased 2.7 million shares for $330.0 million.
The central Q2 issue was not the headline EPS beat alone. Revenue declined, comparable sales fell substantially, and profitability benefited from a one-time $134.5 million IEEPA tariff refund plus $4.1 million of related interest. Management simultaneously cut its full-year outlook, signaling a more difficult demand and operating environment.
Top Financial Highlights
- Total net revenue decreased 4% year over year to $2.416 billion; on a constant-currency basis, revenue declined 5%.
- Comparable sales declined 9% reported and 10% on a constant-dollar basis.
- Diluted EPS was $2.92, down from $3.10 in Q2 fiscal 2025.
- Net income declined 11.2% to $329.2 million, from $370.9 million a year earlier.
- Gross profit declined 1.0% to $1.462 billion.
- Gross margin increased 200 basis points to 60.5%, versus 58.5% a year ago; however, tariff refunds added 560 basis points to the quarter’s gross margin.
- Income from operations decreased 13.4% to $453.7 million, while operating margin contracted 190 basis points to 18.8%.
- Selling, general and administrative expenses rose to $1.006 billion, or 41.7% of revenue, versus $951.7 million, or 37.7%, in Q2 fiscal 2025.
- Americas revenue fell 8%, while international revenue increased 4% reported, or 2% on a constant-dollar basis.
- Americas comparable sales dropped 12%; international comparable sales declined 3% reported and 6% on a constant-dollar basis.
- China Mainland revenue rose 4% reported but declined 2% on a constant-dollar basis; Rest of World revenue increased 5% reported and 6% at constant currency.
- Cash and cash equivalents totaled $1.390 billion as of August 2, 2026; available capacity under the committed revolving credit facility was $593.7 million.
- Inventory was $1.711 billion, down 1% year over year in dollars and down 7% on a unit basis.
- For the first two quarters of fiscal 2026, operating cash flow was $589.3 million, compared with $209.7 million in the prior-year period. The release does not provide a standalone quarterly operating cash flow figure.
- The company added nine net new company-operated stores during the quarter, finishing with 825 stores and 3.88 million gross square feet.
- Q3 fiscal 2026 guidance calls for revenue of $2.290 billion–$2.320 billion, down 10%–11% year over year, and diluted EPS of $0.93–$0.98.
- Full-year fiscal 2026 guidance was reduced to revenue of $10.350 billion–$10.500 billion and diluted EPS of $9.48–$9.73. The annual EPS outlook includes the Q2 tariff-refund benefit of $0.86 per share but excludes any potential future tariff refunds.
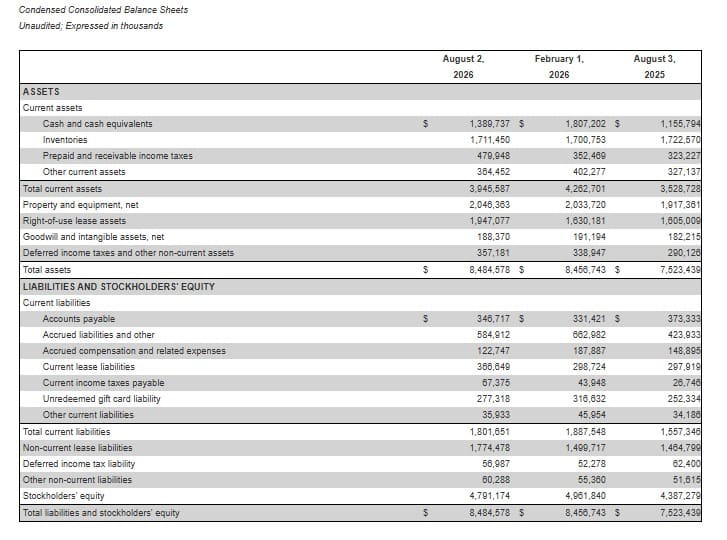
lululemon athletica inc. Condensed Consolidated Balance Sheets
(Source: businesswire.com)
- The table presents lululemon athletica inc.’s unaudited condensed consolidated balance sheet, with figures expressed in thousands, as of August 2, 2026, February 1, 2026, and August 3, 2025.
- As of August 2, 2026, total assets stood at $8.48 billion, compared with $8.46 billion in February 2026 and $7.52 billion in August 2025. This represents year-over-year asset growth of approximately 12.8%. Current assets reached $3.95 billion, supported by $1.39 billion in cash and cash equivalents and $1.71 billion in inventories.
- Property and equipment increased to $2.05 billion, while right-of-use lease assets rose to $1.95 billion, compared with $1.61 billion a year earlier. The increase indicates continued expansion in leased retail and operating locations.
- Total current liabilities were $1.80 billion in August 2026, compared with $1.56 billion in August 2025. Major current liabilities included $584.9 million in accrued liabilities and other expenses, $366.6 million in current lease liabilities, and $346.7 million in accounts payable. Non-current lease liabilities also increased to $1.77 billion, from $1.46 billion a year earlier.
- Stockholders’ equity reached $4.79 billion as of August 2026, up from $4.39 billion in August 2025, representing growth of approximately 9.2%. Overall, the balance sheet reflects a larger asset base, higher lease-related assets and liabilities, and stronger year-over-year stockholders’ equity, while cash remained below the February 2026 level.
Beat or Miss?
lululemon’s revenue result fell short of Wall Street’s expectations, while EPS was above consensus. The EPS comparison needs care: the reported GAAP figure included the non-recurring tariff-refund and related-interest effect, worth $0.86 per diluted share after tax. On that basis, the underlying quarterly GAAP EPS before this benefit would have been approximately $2.06, still above the LSEG-adjusted consensus figure of $1.79 cited by CNBC, but far less dramatic than the headline $2.92 result.
| Metric | Reported | Difference/Analysis |
| Revenue | $2.416 billion | Missed the approximately $2.46 billion LSEG consensus by about $40 million–$45 million, or roughly 1.6%–1.8%. |
| Diluted GAAP EPS | $2.92 | Exceeded LSEG’s $1.79 adjusted EPS consensus by $1.13. Comparability is limited because reported GAAP EPS included a $0.86 tariff-refund and related-interest benefit. |
| Diluted GAAP EPS before Q2 tariff-refund benefit | Approximately $2.06 | Illustrative calculation: $2.92 reported EPS less $0.86 refund/interest effect. This amount remains above $1.79 but should not be read as a company-provided adjusted EPS measure. |
| Q3 revenue outlook midpoint | $2.305 billion | Below analysts’ expectations; one post-results analysis characterized the midpoint as approximately 8.8% below consensus. |
| Q3 diluted EPS outlook | $0.93–$0.98 | The range signals a sharp year-over-year profit decline following Q2’s tariff-related benefit and weaker expected sales. |
| Fiscal 2026 revenue outlook | $10.350 billion–$10.500 billion | Revised down from the prior $11.000 billion–$11.150 billion outlook. |
| Fiscal 2026 EPS outlook | $9.48–$9.73 | Revised down from the prior $10.95–$11.15 range, although the new outlook includes the $0.86 Q2 tariff-refund benefit. |
What Leadership Is Saying
Interim Co-CEO and CFO Meghan Frank emphasized expense discipline, product improvement, marketing investment, and the revised outlook:
“While we continue to navigate some challenging dynamics, we are taking a prudent approach with our revised full-year outlook. Our teams remain focused on accelerating growth by strengthening our product offerings, increasing our marketing investments, and maintaining disciplined expense management.”
Interim Co-CEO, President, and Chief Commercial Officer André Maestrini focused on operational recovery and the incoming CEO transition:
“We remain confident in our ability to take the right steps to strengthen our performance and deliver sustainable growth over time… We look forward to welcoming our incoming CEO, Heidi O’Neill, next week as we begin an exciting new chapter for the company.”
A meaningful editorial point for investors is that the press release does not provide a separate CFO quotation specifically quantifying margins. Frank’s comments instead tie financial management to a cautious outlook, higher marketing investment, product initiatives, and disciplined expense control. The company’s reported margin improvement was heavily influenced by tariff refunds, while operating margin still declined year over year.
Historical Performance
| Category | Q2 Fiscal 2026 | Q2 Fiscal 2025 | Change (%) |
| Revenue | $2.416 billion | $2.525 billion | -4.30% |
| Net income | $329.2 million | $370.9 million | -11.20% |
| Gross profit | $1.462 billion | $1.477 billion | -1.00% |
| Gross margin | 60.50% | 58.50% | +200 bps |
| Selling, general and administrative expense | $1.006 billion | $951.7 million | 5.70% |
| Operating income | $453.7 million | $523.8 million | -13.40% |
| Operating margin | 18.80% | 20.70% | -190 bps |
| Diluted EPS | $2.92 | $3.10 | -5.80% |
| Cash and cash equivalents | $1.390 billion | $1.156 billion | 20.20% |
| Inventory | $1.711 billion | $1.723 billion | -0.60% |
Note: The gross-margin expansion does not indicate a clean underlying improvement. It includes a 560-basis-point benefit from $134.5 million of tariff refunds recognized as a reduction in cost of goods sold.
Competitor Historical Performance
The company release does not report a standardized current-quarter, prior-year-quarter, and percentage-change financial comparison for competitors. Therefore, a direct competitor table using verified Q2 fiscal 2026 data cannot be completed reliably from the supplied announcement or the current-source set without mixing reporting calendars, accounting conventions, and non-comparable quarters.
| Category | lululemon Q2 Fiscal 2026 | Prior-Year Q2 | Change (%) |
| Revenue | $2.416 billion | $2.525 billion | -4.30% |
| Net income | $329.2 million | $370.9 million | -11.20% |
| Selling, general and administrative expense | $1.006 billion | $951.7 million | 5.70% |
For a peer-comparison article, the most comparable athletic-apparel names would generally include Nike, adidas, Under Armour, and VF Corp. However, a defensible table should align each company’s reported fiscal quarter and use their primary filings or earnings releases rather than mixing third-party estimates.
The most relevant competitive signal within lululemon’s own release is regional: Americas revenue fell 8%, and Americas comparable sales fell 12%, whereas international revenue increased 4% despite a 3% reported decline in international comparable sales.
How the Market Reacted?
The market reaction was decisively bearish. LULU had closed the regular September 3 session at $121.77, up 1.42% on the day, but fell about 17.8% in after-hours trading to $100.08 after the results, according to earnings-call coverage. Other immediate coverage described a roughly 20% premarket decline on the following day after investors absorbed the revenue miss, weak comparable sales, and reduced full-year outlook.
By September 4, shares closed at $100.61, down 17.38% for the session. The sharp sell-off suggests investors placed greater weight on weakening sales trends, North American pressure, and the lower forecast than on the headline EPS beat, particularly because the reported EPS was materially aided by one-time tariff refunds.

Sources


