








Quick Verdict
Coca-Cola delivered adjusted EPS of $0.91 and revenue of $13.4 billion, beating Wall Street expectations while raising full-year guidance. GAAP EPS reached $0.93 as global beverage volumes grew 5%. Shares nevertheless fell less than 1% in morning trading, reflecting caution over flat North American volumes and consumer demand
About The Coca-Cola Company
The Coca-Cola Company (NYSE: KO) is an Atlanta, Georgia-based beverage business whose origins date to 1886. Its portfolio spans sparkling soft drinks, water, sports drinks, coffee, tea, juice, and value-added dairy. Alongside its namesake Coca-Cola brand, its earnings release highlights Coca-Cola Zero Sugar, Sprite, Minute Maid, fairlife, Maaza, and other beverages serving different consumer occasions. The company works across geographic operating segments and a Bottling Investments business, combining brand development with a global bottling system.
Coca-Cola’s market capitalization was approximately $392.3 billion as of October 27, 2026, according to Stock Analysis. Business Wire’s accompanying company profile listed 65,900 employees. These figures describe the listed company rather than the much larger employment footprint of its wider bottling and distribution system. This quarter’s investment story centers on international volume growth, expanding operating margins and higher earnings expectations, balanced against flat North American volumes and continued pressure on consumer spending.
Top Financial Highlights
- Total revenue: $13.380 billion, rounded to $13.4 billion in the announcement, versus $12.455 billion a year earlier. Coca-Cola reported 7% growth
- Net income attributable to Coca-Cola shareowners: $4.009 billion, up 8% from $3.696 billion. Consolidated net income, before deducting noncontrolling interests, was $4.056 billion.
- Earnings per share: GAAP diluted EPS increased 8% to $0.93; comparable, non-GAAP EPS rose 11% to $0.91.
- Gross profit and margin: Gross profit reached $8.450 billion. GAAP gross margin, calculated as gross profit divided by revenue, was approximately 63.2%, up from 61.5% a year earlier.
- Operating profitability: Operating income rose 12% to $4.465 billion. Reported operating margin expanded to 33.4% from 32.0%; comparable operating margin increased to 32.9% from 31.9%.
- Operating cash flow: Cash from operations totaled $12.471 billion for the first nine months of 2026—not the third quarter alone.
- Free cash flow: Year-to-date free cash flow, a non-GAAP measure, was approximately $11.4 billion.
- North America revenue: $5.386 billion, up 3% as reported, despite flat unit case volume.
- Europe, Middle East and Africa revenue: $3.104 billion, up 4% as reported, with unit case volume growing 5%
- Latin America revenue: $1.958 billion, up 25% as reported; organic revenue increased 16%, and unit case volume rose 6%
- Volume and brand momentum: Global unit case volume increased 5%, led by India, China, Mexico and Brazil. Coca-Cola Zero Sugar volume grew 16%.
- Cash on hand: Cash and cash equivalents were $13.454 billion as of October 2. Including short-term investments, the total was $13.685 billion.
- Raised full-year guidance: Coca-Cola now expects at least 5% organic revenue growth and at least 11% comparable EPS growth, versus approximately 5% and 9%–10%, respectively, previously. Free cash flow guidance increased to at least $13.0 billion from approximately $12.4 billion.
Beat or Miss?
Coca-Cola delivered a beat on both adjusted earnings and revenue against the LSEG consensus reported by CNBC. The comparison uses adjusted EPS rather than GAAP EPS to keep the earnings measure consistent with analyst expectations.
| Metric | Reported | Difference/Analysis |
| Comparable/adjusted EPS | $0.91 | Versus $0.88 expected; beat by $0.03, or approximately 3.4%. |
| Revenue | $13.380 billion | Versus $12.92 billion expected; approximately $460 million, or 3.6%, above consensus using unrounded reported revenue. |
| GAAP diluted EPS | $0.93 | Comparable GAAP consensus estimate: N/A in the reviewed sources. |
| Net income attributable to shareowners | $4.009 billion | Consensus estimate: N/A; increased from $3.696 billion a year earlier. |
| Reported operating margin | 33.40% | Consensus estimate: N/A; improved from 32.0% a year earlier. |
Sources: Coca-Cola’s financial statements and CNBC’s LSEG consensus comparison. Percentage surprises are calculated from the displayed figures.
The results also show why revenue growth and consumer demand are not interchangeable. Concentrate sales increased 7%, but unit case volume grew 5%; Coca-Cola attributed the two-point difference to shipment timing. Price/mix added 1%, while currency and divestiture effects also influenced reported revenue.
The Coca-Cola Company And Subsidiaries Consolidated Statements Of Cash Flows
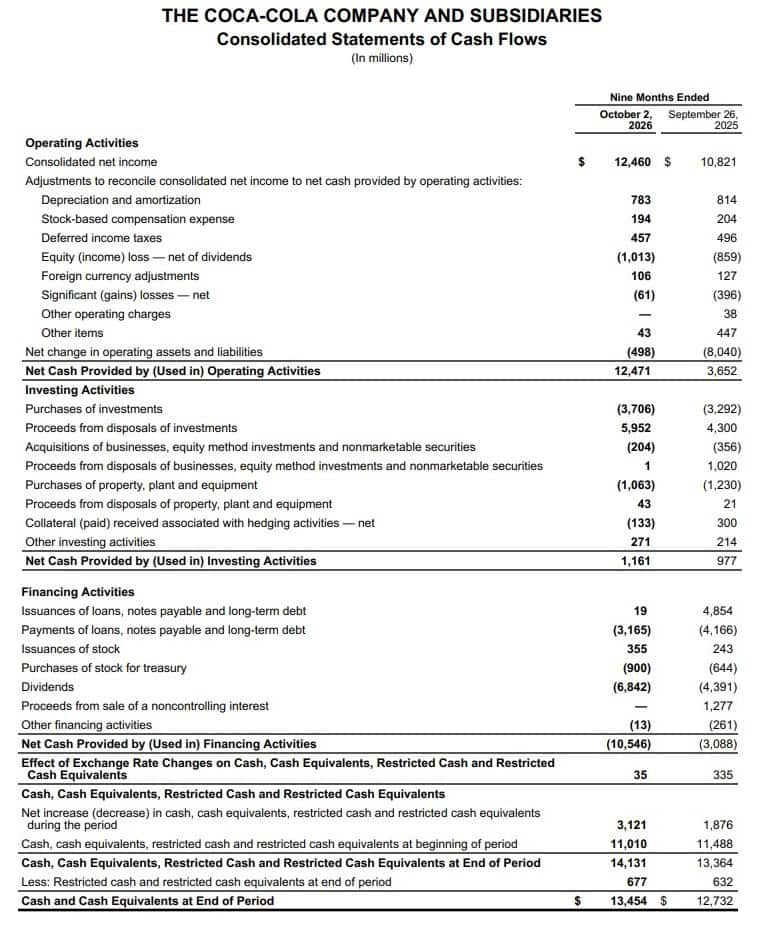
- The table presents The Coca-Cola Company and its subsidiaries’ consolidated statement of cash flows for the nine months ended October 2, 2026, compared with the same period in 2025.
- Cash generated from operating activities increased significantly to $12.47 billion from $3.65 billion, while investing activities provided $1.16 billion of net cash. Financing activities used $10.55 billion, mainly due to dividend payments and debt repayments.
- As a result, cash, cash equivalents, and restricted cash increased to $14.13 billion at the end of the period, with cash and cash equivalents alone reaching $13.45 billion, compared with $12.73 billion a year earlier.
What Leadership Is Saying
“By staying close to consumers and executing with agility across our global system, we are delivering quality growth while continuing to invest in the capabilities, brands and people that will fuel our future.” — Henrique Braun, CEO, in the earnings announcement.
“Importantly, margin expansion did not come at the expense of investment, and we continue to drive greater productivity and efficiency across our operations.”— John Murphy, president and CFO, on the third-quarter earnings call.
Historical Performance
Coca-Cola’s Q3 comparison covers the three months ended October 2, 2026, against the three months ended September 26, 2025. Dollar amounts below are in millions, except for per-share figures.
| Category | Q3 2026 | Q3 2025 | Change (%) |
| Revenue | $13,380 | $12,455 | 7.40% |
| Net income attributable to shareowners | $4,009 | $3,696 | 8.50% |
| Selling, general and administrative expenses | $3,975 | $3,618 | 9.90% |
| Operating income | $4,465 | $3,982 | 12.10% |
| GAAP diluted EPS | $0.93 | $0.86 | 8.10% |
Changes are calculated from the displayed financial-statement amounts. Coca-Cola reports rounded headline growth rates of 7% for revenue, 8% for attributable net income and EPS, and 12% for operating income.
Operating income grew faster than sales even though selling, general and administrative expenses increased. Gross profit rose from $7.658 billion to $8.450 billion, while other operating charges declined from $58 million to $10 million, helping operating profit outpace revenue growth.
Competitor Comparison
PepsiCo (NASDAQ: PEP) provides a relevant competitor comparison, although its consolidated results include both beverages and convenient foods. Its fiscal Q3 covered the 12 weeks ended September 5, 2026, versus September 6, 2025, so the reporting window and business mix differ from Coca-Cola’s. Dollar amounts below are in millions.
| Category | Q3 2026 | Q3 2025 | Change (%) |
| PepsiCo revenue | $25,274 | $23,937 | 5.60% |
| PepsiCo net income attributable to the company | $3,048 | $2,603 | 17.10% |
| PepsiCo selling, general and administrative expenses | $9,494 | $9,122 | 4.10% |
| PepsiCo operating profit | $4,260 | $3,569 | 19.40% |
Coca-Cola reported stronger organic revenue growth—7%, compared with PepsiCo’s 3.1%. PepsiCo’s GAAP operating profit increased faster, but its core operating profit rose only 3%, and core operating margin contracted by 35 basis points. That distinction matters: headline profit growth alone does not establish which business delivered stronger underlying performance.
The outlooks also diverged. Coca-Cola raised its comparable EPS growth forecast to at least 11%, while PepsiCo reduced its core EPS growth forecast to 2.5%–3.5%, from the low end of its previous 5%–7% range. These are company-specific non-GAAP measures, not identical accounting metrics.
How the Market Reacted?
Coca-Cola shares fell less than 1% in morning trading on October 27, according to CNBC, despite the earnings beat and higher guidance. The report linked investor caution to management’s subdued assessment of the consumer environment, while North American unit case volume remained flat. International growth and improved profitability therefore produced a more positive operating picture than the initial share-price response suggested. This is a timestamped intraday reaction, not a verified closing or after-hours return.