









Quick Verdict
Robinhood reported third-quarter revenue of $1.424 billion, up 12%, with diluted EPS of $0.51 and adjusted EPS of $0.60. Revenue matched rounded Wall Street expectations, but GAAP earnings missed. Shares fell approximately 4% after hours as weaker cryptocurrency revenue and higher expenses overshadowed growth in options and prediction markets.
About Robinhood Markets, Inc.
Robinhood Markets, Inc. trades on Nasdaq under the ticker HOOD. Founded in 2013 by Vlad Tenev and Baiju Bhatt, the Menlo Park, California-based company operates a financial-services platform spanning retail brokerage, cryptocurrency trading, investment advice, digital banking services and private-market access. Its products bring investing, trading and cash-management services into a broader customer ecosystem. Barron’s lists approximately 2,900 employees, although that figure should not be treated as a newly disclosed quarter-end headcount.
As of October 27, Robinhood’s reported market capitalization was approximately $85.02 billion, with a quoted price-to-earnings ratio of 41.66. These market-based figures are snapshots rather than fixed quarterly results. As of September 30, Robinhood served 28.7 million funded customers and held $396 billion in total platform assets. Its paid Robinhood Gold subscription reached 5.2 million subscribers, illustrating how the company is expanding customer relationships beyond individual trades into recurring services and additional financial products.
Top Financial Highlights
- Total net revenue: $1.424 billion, up 12% year over year and 9% sequentially, setting a quarterly record.
- Net income: $476 million, down 14%. Net income attributable to Robinhood was $468 million after $8 million attributable to non-controlling interests.
- Diluted EPS: $0.51, down 16% from $0.61. Adjusted EPS, a non-GAAP measure introduced this quarter, was $0.60, down 3%.
- Investment valuation impact: Results included $67 million, or $0.07 per diluted share, of unrealized losses primarily associated with Robinhood Ventures Fund I.
- Transaction-based revenue: $867 million, up 19%, making it the largest of the company’s three disclosed revenue categories. These categories are revenue streams, not separately reported operating segments.
- Trading revenue breakdown: Options generated $399 million, up 31%; event contracts generated $173 million, more than six times the prior-year level; equities generated $121 million, up 41%.
- Cryptocurrency revenue: $120 million, down 55%, partially offsetting growth elsewhere in transaction-based revenue.
- Net interest revenue: $415 million, down 9%, reflecting lower securities-lending activity and short-term interest rates, partly offset by growth in interest-earning assets.
- Other revenue: $142 million, up 61%, primarily driven by Trump Account service revenue and higher Robinhood Gold subscription revenue.
- Operating expenses: $739 million, up 16%. Credit-loss provisions increased to $71 million from $26 million as the credit-card loan book expanded.
- Gross margin: Not separately reported. Robinhood disclosed a 33% net margin and a 57% adjusted EBITDA margin; neither should be substituted for gross margin. Adjusted EBITDA increased 9% to $808 million
- Operating cash flow: $1.225 billion of cash provided by operating activities, compared with $1.576 billion used a year earlier. The cash-flow statement includes substantial movements in brokerage-related assets and liabilities.
- Cash on hand: Cash and cash equivalents totaled $5.829 billion, excluding separately disclosed segregated and restricted cash.
- Customer growth: Funded customers reached 28.7 million, up 7%; Gold subscribers increased 34% to 5.2 million; quarterly net deposits totaled $15.7 billion.
- Guidance: Robinhood lowered the upper end of its full-year 2026 adjusted operating expenses and share-based compensation outlook to $2.750 billion from $2.775 billion, leaving the lower end at $2.675 billion. The release did not provide next-quarter revenue or EPS guidance.
Robinhood Markets, Inc.Condensed Consolidated Statements Of Operations
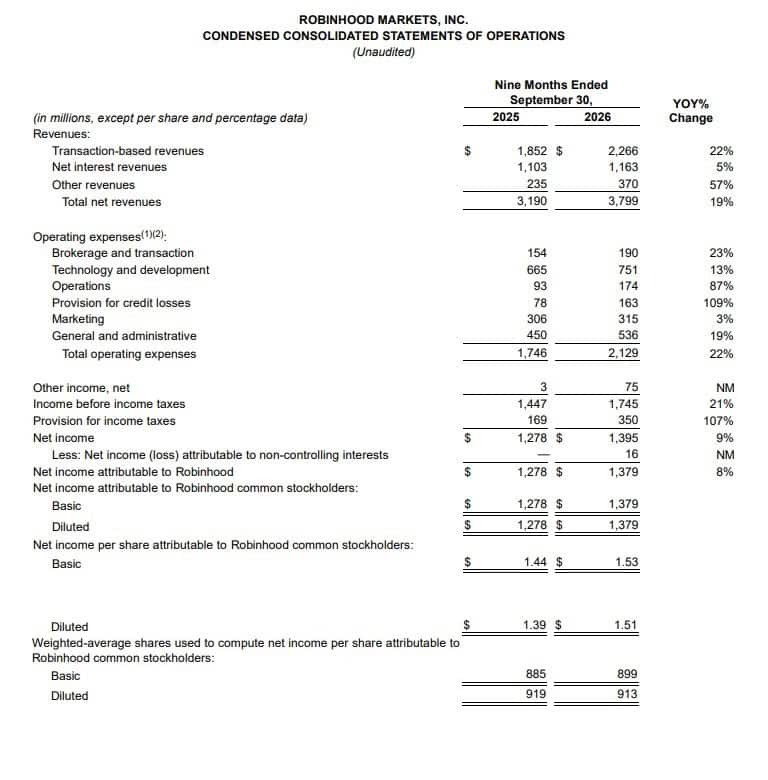
- The table presents Robinhood Markets, Inc.’s condensed consolidated statements of operations for the nine months ended September 30, 2026, compared with the same period in 2025. Total net revenues increased 19% to $3.80 billion, driven by higher transaction-based, net interest, and other revenues.
- Total operating expenses rose 22% to $2.13 billion, with notable increases in provisions for credit losses and operating costs. Net income increased 9% to $1.40 billion, while diluted net income per share increased from $1.39 to $1.51.
Beat or Miss?
Robinhood delivered a mixed quarter: revenue met the rounded LSEG consensus reported by CNBC, while GAAP EPS fell short. The table uses that same coverage for the headline expectations, avoiding comparisons between GAAP earnings and differently defined adjusted earnings estimates.
| Metric | Reported | Difference/Analysis |
| Total net revenue | $1.424 billion | Approximately in line with LSEG’s $1.42 billion estimate at the published rounding precision. |
| GAAP diluted EPS | $0.51 | $0.05 below the $0.56 LSEG estimate. |
| Transaction-based revenue | $867 million | $12 million below StreetAccount’s $879 million estimate. |
| Adjusted EPS, non-GAAP | $0.60 | No directly comparable adjusted consensus established in the selected CNBC coverage; not compared with the $0.56 GAAP benchmark. |
| Consolidated net income | $476 million | N/A: no consensus estimate provided in the selected coverage. |
Other earnings services published different consensus figures and sometimes described adjusted EPS as a beat. Those headlines are not necessarily comparable: the earnings definition and analyst sample must match before calculating a surprise. CNBC’s clearly identified comparison supports the narrower conclusion that GAAP EPS missed while rounded revenue met expectations.
What Leadership Is Saying
“Our vision is to make everyone an owner, because broad ownership is essential to a free, stable, and prosperous society.” — Vlad Tenev, chairman and CEO
Tenev’s statement frames Robinhood’s expansion around wider ownership rather than trading alone. The quarter’s release highlighted continued development across banking, managed investing, retirement products and international services alongside its active-trading platform.
“Customers are trusting us with more of their assets as we deliver on our product roadmap, leading to our highest quarter ever for revenues.” — Shiv Verma, chief financial officer
Verma also said October net deposits had exceeded $13 billion month to date, including $6 billion from the Dell family’s contribution to Trump Accounts. That is a post-quarter operating update, not revenue or earnings guidance. Management’s financial outlook separately attributed the lower expense-guidance ceiling to ongoing efficiency gains.
Historical Performance
Robinhood’s revenue growth did not translate into higher quarterly net income. Operating expenses increased faster than revenue, while higher taxes and investment-related losses also weighed on earnings.
| Category | Q3 2026 | Q3 2025 | Change (%) |
| Total net revenue | $1.424 billion | $1.274 billion | 12% |
| Consolidated net income | $476 million | $556 million | −14% |
| Net income attributable to Robinhood | $468 million | $556 million | −16% |
| Total operating expenses | $739 million | $639 million | 16% |
| Diluted EPS | $0.51 | $0.61 | −16% |
| Adjusted EBITDA, non-GAAP | $808 million | $742 million | 9% |
The distinction between consolidated net income and income attributable to Robinhood matters: the former includes non-controlling interests, while the latter is the earnings base attributable to Robinhood shareholders. Robinhood’s disclosed net margin fell to 33% from 44%, even as adjusted EBITDA reached $808 million.
Competitor comparison: Charles Schwab
Charles Schwab provides a verified brokerage-sector comparison for the same quarter. Its October 15 earnings release showed revenue growing faster than expenses, with net income increasing—contrasting with Robinhood’s lower quarterly earnings. The businesses differ materially in scale and revenue mix, so this is a directional comparison rather than a like-for-like operating benchmark.
| Category | Q3 2026 | Q3 2025 | Change (%) |
| Charles Schwab: net revenue | $7.171 billion | $6.135 billion | 17% |
| Charles Schwab: GAAP net income | $2.906 billion | $2.358 billion | 23% |
| Charles Schwab: expenses excluding interest | $3.394 billion | $3.114 billion | 9% |
Schwab’s net interest revenue rose 14% to $3.476 billion, whereas Robinhood’s declined 9% to $415 million. This divergence helps explain why stronger trading engagement did not produce the same earnings outcome at both firms.
How the Market Reacted?
Robinhood shares fell approximately 4% in after-hours trading following the October 27 release, according to CNBC’s report updated at 5:07 p.m. EDT. That represents a timestamped reaction, not a final extended-hours closing return. The report paired the decline with weaker-than-expected earnings and a 55% contraction in cryptocurrency revenue, despite strong options and event-contract growth. The immediate market response was negative even though Robinhood reported record revenue and substantial customer inflows.

Sources