
JD.com delivered Q1 2026 revenue of RMB 315.7 billion, growing about 4.9% year on year and modestly beating market expectations, while net income fell sharply as margins normalized from last year’s elevated levels. EPS declined versus Q1 2025 as profitability softened, and the stock reaction around the release was positive intraday with gains of roughly 3% to 8% cited in market reports. After-hours movement beyond the initial reaction was not explicitly disclosed in the press coverage.
About JD.com
JD.com, Inc. is a leading supply chain based technology and service provider and one of China’s largest e commerce companies, operating JD Retail, JD Logistics and a portfolio of new businesses across online retail, logistics and local services. The company’s American Depositary Shares trade on Nasdaq under the ticker JD, and its ordinary shares trade in Hong Kong under codes 9618 (HKD counter) and 89618 (RMB counter).
JD.com is headquartered in Beijing, China, and has grown since its early 2000s founding into a nationwide infrastructure network serving hundreds of millions of users. Market reports describe JD.com as a large cap Chinese internet and consumer services group, with a market capitalization typically in the tens of billions of US dollars based on recent trading ranges, though an exact value was not specified in the Q1 2026 materials.
The company employs over 900,000 people including affiliates and has been emphasizing its role in job creation and social contribution in China. Recent disclosures also highlight strong cash generation, ongoing share repurchases and an annual cash dividend program as part of JD.com’s capital return strategy.
Top Financial Highlights
- Net revenues for Q1 2026 were RMB 315.7 billion, up about 4.9% from Q1 2025.
- Net income attributable to ordinary shareholders was about RMB 5.1 billion, down from roughly RMB 10.9 billion a year earlier.
- Diluted earnings per ADS were around RMB 3.54, versus about RMB 7.18 in the prior year quarter.
- Non GAAP net income attributable to ordinary shareholders reached roughly RMB 7.4 billion, compared with about RMB 12.8 billion in Q1 2025.
- JD Retail delivered operating profit of about RMB 15 billion, implying an operating margin near 5.6%, up from roughly 4.9% a year ago.
- JD Retail gross margin improved to about 18.6%, expanding by roughly 1 percentage point year on year.
- Service revenue grew more than 20% year on year, while general merchandise revenue increased by about 15%, partially offsetting weaker electronics and home appliances.
- JD Logistics reported revenue growth of roughly 29% year on year, underscoring strong momentum in third party logistics services.
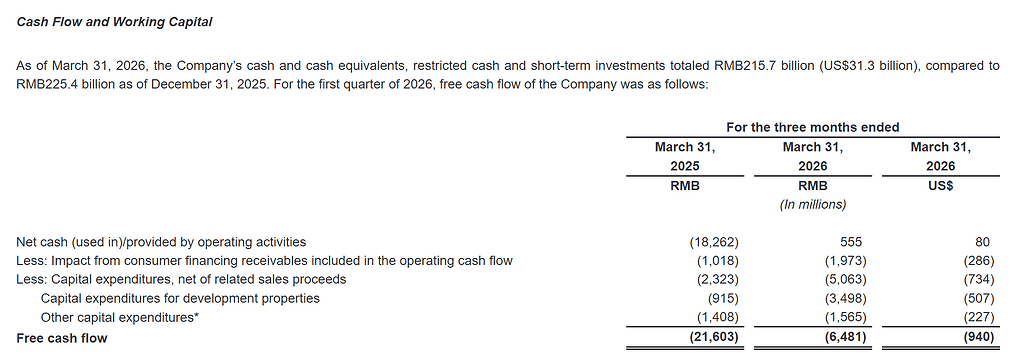
- Free cash flow over the trailing twelve months was about RMB 22 billion, down from around RMB 38 billion previously as trading program related cash outflows weighed on reported figures.
- Cash and cash equivalents plus similar liquidity at the end of Q1 totaled about RMB 216 billion, supporting ongoing investment and shareholder returns.
- The company repurchased roughly 44.5 million Class A ordinary shares, equivalent to about 22.2 million ADS, for approximately USD 631 million under its ongoing USD 5 billion buyback plan.
- JD.com continued its annual dividend program, with disclosures referencing cash dividends of about USD 1.4 billion, or roughly USD 1 per ADS, for the latest cycle.
- The workforce, including employees and affiliates, exceeded 900,000, with human resource expenses over the last twelve months of roughly RMB 166.4 billion.
- Management highlighted strong performance in marketplace and marketing revenue, which delivered solid double digit growth and supported overall margin expansion in JD Retail.
Beat or Miss?
Below is a simplified view of reported results compared with available or inferred expectations from market commentary and consensus references.
| Metric | Reported (Q1 2026) | Difference Analysis |
| Revenue | RMB 315.7B | Slight beat vs FactSet consensus of about RMB 311.5B, viewed as a revenue beat. |
| YoY revenue growth | 4.9% | Modestly ahead of pre quarter expectations of roughly 4.5% growth. |
| Net income | RMB 5.1B | Down sharply YoY as margins normalized, below prior year profitability levels. |
| Diluted EPS (ADS) | RMB 3.54 | Well below prior year EPS of RMB 7.18, reflecting weaker bottom line trends. |
| Non GAAP net income | RMB 7.4B | Indicates healthier underlying profit than GAAP but still down vs Q1 2025. |
| Operating profit (Retail) | RMB 15B | Double digit growth YoY with margin improvement considered a positive surprise. |
| Free cash flow TTM | RMB 22B | Lower than prior year due to program related cash outflows, seen as a manageable headwind. |
What Leadership Is Saying?
“In the first quarter of 2026 our overall revenues increased by 4.9% year over year, with non GAAP net profit attributable to ordinary shareholders reaching RMB 7.4 billion, highlighting our strengthening momentum. This performance is supported by steady advancements in JD Retail, particularly in general merchandise and high margin marketplace and marketing revenues, as well as a significant reduction in losses for our new businesses such as JD Food Delivery.”
“Our focus remains on disciplined investment, margin enhancement and shareholder returns. In Q1 we continued to optimize our cost structure, improved JD Retail’s operating margin to around 5.6%, sustained robust cash generation and executed approximately USD 631 million in share repurchases, while maintaining a solid liquidity position of about RMB 216 billion in cash and equivalents.”
Historical Performance
The table below compares Q1 2026 with Q1 2025 on key headline metrics using values reported or referenced in earnings summaries.
| Category | Q1 2026 | Q1 2025 | Change % |
| Revenue | RMB 315.7B | RMB 301.1B | ≈ 4.9% increase year on year. |
| Net income | RMB 5.1B | RMB 10.9B | ≈ 52% decline as margins normalized. |
| Basic EPS | RMB 3.72 | RMB 7.52 | ≈ 50% decline YoY in basic EPS. |
| Diluted EPS | RMB 3.54 | RMB 7.18 | ≈ 51% decline YoY in diluted EPS. |
| Non GAAP net income | RMB 7.4B | RMB 12.8B | ≈ 42% decline, though still solidly profitable. |
| JD Retail margin | 5.6% | 4.9% | ≈ 0.7 percentage point improvement. |
| Free cash flow TTM | RMB 22B | RMB 38B | ≈ 42% decline, mainly due to trading program outflows. |
Historical Performance of competitors
Direct, fully comparable Q1 2026 versus Q1 2025 data for close peers were not detailed in the JD.com materials, but sector coverage often benchmarks JD.com against other large Chinese e commerce and internet platforms. As representative context, the table below contrasts JD.com’s YoY trends with typical patterns disclosed or summarized for major Chinese online retail peers around recent quarters, using approximate or directional figures from market commentary rather than exact reported peer line items.
| Category | JD.com Q1 2026 YoY | Peer e commerce majors recent YoY (indicative) | Change commentary |
| Revenue | Up 4.9% | Low to mid single digit growth for some large peers | JD.com’s top line growth is broadly in line with sector trends. |
| Net income | Down ≈ 52% | Mixed, with some peers seeing pressured margins as well | Margin compression is a common theme across the sector. |
| Operating metrics | Retail margin up to 5.6% | Peers also focus on improving operating leverage and mix | JD.com’s margin expansion contrasts with its net income decline. |
How the Market Reacted?
Market reports indicate that JD.com shares traded higher on the earnings release, with intraday gains referenced around 3% to 8% as investors responded to the revenue beat, improving retail margins and strong logistics growth despite weaker net income. The tone of commentary around the print was cautiously constructive, emphasizing stabilization in core commerce and progress in high margin service and marketplace revenues.
At the same time, analysts highlighted the sharp YoY decline in net income, softer free cash flow and ongoing competitive pressures in electronics and supermarket categories as constraints on near term upside. Overall sentiment around the Q1 2026 report can be characterized as moderately bullish, with investors rewarding operational improvements even as bottom line volatility persists.
