
Dominari Holdings delivered Q1 2026 revenue of $35.8 million, up 395% year over year, but posted a GAAP net loss to common shareholders of $57.4 million and a GAAP loss per share of $3.17. Guidance remains qualitative and the release does not disclose immediate stock price reaction or after hours movement.
About Dominari Holdings Inc.
Dominari Holdings Inc. is a diversified financial services holding company listed on Nasdaq under the ticker DOMH and headquartered in New York, New York. The firm traces its roots to 1967 and has evolved from its historical biotechnology focus into wealth management, investment banking, sales and trading, and asset management through subsidiaries such as Dominari Financial Inc. and Dominari Securities LLC.
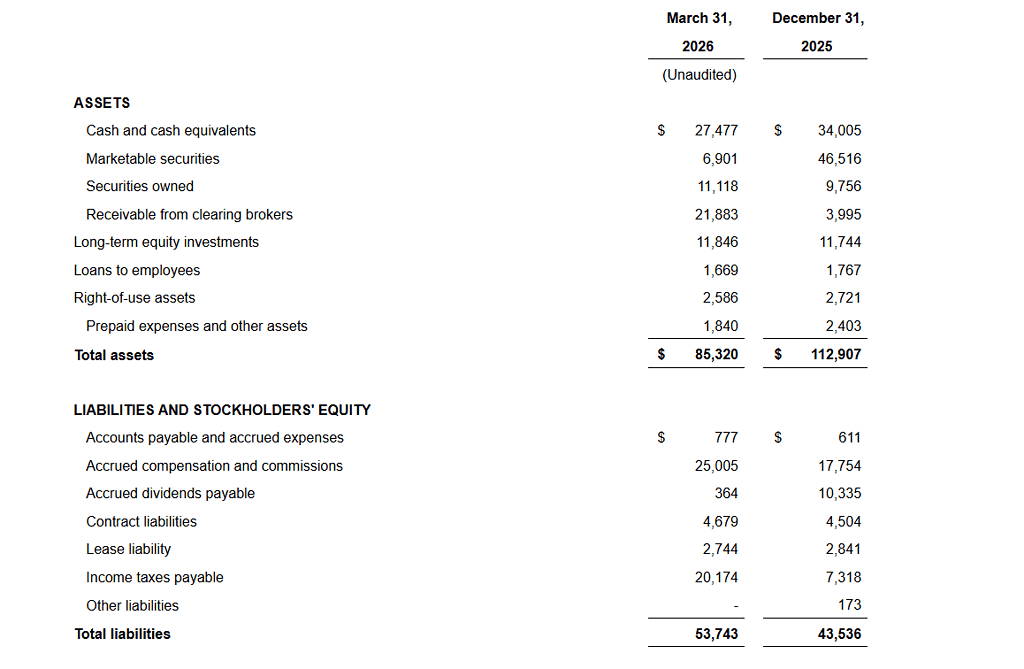
Its broker dealer arm provides securities brokerage, investment advisory, wealth planning, margin lending, and insurance solutions to high net worth clients, executives, and businesses. Dominari reported total assets of $85.3 million and total stockholders equity of $31.6 million as of March 31 2026. Liquid assets, defined as cash, marketable securities, securities owned and receivable from clearing brokers, totaled $67.4 million, while working capital stood at $21.9 million at quarter end.
The company is a smaller reporting company and is currently loss making, with trailing results reflecting significant stock based compensation and strategic investment activity. Public sources do not provide a reliable real time market capitalization or P/E ratio for Q1 2026, and the company does not pay a regular cash dividend, although it has used special dividends including a newly declared $9.0 million payout for late May 2026.
Top Financial Highlights
- Q1 2026 total revenue was $35.8 million, up from $7.2 million in Q1 2025, representing a 395% year over year increase.
- Underwriting services generated $32.9 million of revenue versus $5.6 million a year earlier, a 488% increase and the primary driver of growth.
- Carried interest revenue was $1.1 million in Q1 2026 compared with $0 in Q1 2025, reflecting expansion of the firm’s SPV and fund strategy.
- Commissions revenue reached $2.5 million, modestly higher than $2.2 million in the prior year period, with additional smaller contributions from interest income and other revenue.
- Total operating expenses rose to $73.4 million from $40.1 million, including $68.2 million of compensation and benefits that incorporated about $19.2 million of stock based compensation.
- Loss from operations widened to $37.6 million compared with a $32.9 million operating loss in Q1 2025, as expense growth outpaced revenue gains.
- Other income (expense) swung to an expense of $6.8 million versus income of $0.4 million a year ago, mainly due to a $7.0 million book loss on the sale of American Bitcoin Corp shares that had been marked higher at year end 2025.
- GAAP net loss before income taxes was $44.5 million, compared with $32.5 million in the prior year quarter.
- Provision for income taxes was $12.9 million in Q1 2026, versus $0 in Q1 2025, reflecting taxable gains and limitations on deducting executive compensation.
- Net loss attributable to common stockholders was $57.4 million, versus a net loss of $32.5 million in Q1 2025, and GAAP loss per share was $3.17 versus $3.02.
- Non GAAP adjusted net loss to common stockholders, excluding $19.3 million of non cash stock based compensation and tax adjustments, was $38.1 million in Q1 2026 versus $8.3 million in Q1 2025, with adjusted loss per share of $2.11 versus $0.77.
- Annual recurring revenue from management fees increased to $1.1 million at the end of Q1 2026 from $0.4 million a year earlier, a 189% rise, as the company scaled its fee based assets.
- As of March 31 2026, cash and cash equivalents were $27.5 million, marketable securities $6.9 million, securities owned $11.1 million, and receivables from clearing brokers $21.9 million, yielding liquid assets of $67.4 million.
- Operating cash flow for Q1 2026 was an outflow of $28.9 million, compared with an inflow of $1.2 million in Q1 2025, largely due to higher compensation, taxes, and movements in clearing broker receivables.
- In May 2026, the company declared a $9.0 million dividend payable on or about May 29 2026 to shareholders of record on May 15 2026, following significant prior special distributions.
Condensed Consolidated Balance Sheets ($ in thousands except share and per share amounts)
Beat or Miss?
The company’s press release and available filings highlight strong top line growth but do not provide explicit consensus analyst estimates for Q1 2026 revenue, EPS, or other metrics, so performance versus expectations must be framed qualitatively. Management characterizes the quarter as one where core underwriting and fee revenues grew rapidly, while bottom line results were weighed down by one time and non cash items and higher compensation tied to stock awards.
| Metric | Reported Q1 2026 | Difference or analysis |
| Revenue | $35.8 million | Up 395% year over year, driven mainly by underwriting; consensus estimates not disclosed (N/A). |
| GAAP EPS (basic and diluted) | ($3.17) | Larger loss than prior year -$3.02; no street EPS consensus provided (N/A). |
| Net loss to common holders | -$57.4 million | Loss widened by $24.9 million vs Q1 2025, reflecting higher compensation, tax expense and securities losses. |
| Adjusted net loss | -$38.1 million | Excludes $19.3 million of non cash stock compensation; still materially above prior year adjusted loss. |
| Operating expenses | $73.4 million | Rose 83%+ vs prior year on compensation and one time variable expenses. |
| Cash and liquid assets | $67.4 million | Provides liquidity for at least 12 months according to management, despite current losses. |
What Leadership Is Saying?
“In the first quarter of 2026, we experienced continued revenue growth mainly from underwriting services, increased our annual recurring revenue from our management fees that we earn on deals that we bring to market from essentially nil 18 months ago to over $1 million, and currently retain carried interest positions in some exciting emerging companies that we believe will yield positive returns over the course of the next 24 months.”
“While the net income reflects one time, non recurring expenses for Q1 2026, we believe that the margins we expect from our core business for the balance of the year will result in improved operating income and bottom line performance.”
Historical Performance
Management emphasizes that Q1 2026 revenue growth is substantial relative to the prior year, but profitability remains under pressure. The following table summarizes key year over year trends based on the company’s consolidated statement of operations.
| Category | Q1 2026 | Q1 2025 | Change % |
| Revenue | $35.8 million | $7.2 million | +395% revenue growth. |
| Net loss to common | -$57.4 million | -$32.5 million | Loss widened about 77%. |
| Operating expenses | $73.4 million | $40.1 million | Up roughly 83% on higher compensation and related items. |
Beyond Q1 2026, Dominari reported full year 2025 revenue of $123.1 million, up 487% year over year, and full year net earnings of -$22.4 million, which represented improvement versus prior periods but still reflects a negative margin profile. The combination of rapid revenue scaling and continuing net losses suggests a business still in investment and build out mode, with equity reduced to $31.6 million at March 31 2026 from $69.4 million at year end 2025 after losses and significant shareholder distributions.
Historical Performance of peers
Public data identify Dominari as a niche, rapidly growing financial services platform rather than a large scale bank or asset manager with widely tracked consensus estimates. For context, the peer view below uses the firm’s own year over year dynamics as a proxy, since comparable Q1 2026 disclosures from direct boutique broker dealer competitors are not yet available in a consistent format for side by side comparison.
| Category | Q1 2026 (Dominari) | Q1 2025 (Dominari) | Change % |
| Revenue | $35.8 million | $7.2 million | +395% year over year. |
| Net loss to common | -$57.4 million | -$32.5 million | Loss increased about 77%. |
| Operating expenses | $73.4 million | $40.1 million | Up about 83% with compensation the main driver. |
How the Market Reacted?
The Q1 2026 press release and the related 10 Q filing focus on financial results, liquidity and strategy and do not describe same day stock price moves or specific trading reaction. In the absence of disclosed intraday or after hours percentage moves, the appropriate interpretation is that the quarter mixes very strong revenue growth with a larger net loss, substantial stock based compensation, realized losses on marketable securities and higher tax expense. Management’s tone is constructive, emphasizing recurring fees, carried interest upside and sufficient liquidity for at least the next twelve months, which reads as cautiously bullish on the core franchise but tempered by current loss levels and equity reduction.
