Shoulder Innovations delivered strong Q1 2026 revenue growth of 65% year over year to $16.7 million, with EPS at $(0.41) as losses widened on higher growth investments. The release does not disclose same‑day stock price reaction, so after‑hours movement remains unclear.
About Shoulder Innovations
Shoulder Innovations, Inc. (NYSE: SI) is a commercial‑stage medical technology company focused exclusively on transforming the shoulder surgical care market. Headquartered in Grand Rapids, Michigan and founded in 2009, the company develops advanced implant systems for shoulder arthroplasty, supported by enabling technologies, instruments and specialized surgeon support. Its ecosystem targets preoperative planning, implant design and procedural efficiency to deliver more predictable outcomes and simpler procedures across sites of care.
As of the latest available data, Shoulder Innovations has a market capitalization of roughly $250–260 million and no regular dividend, reflecting its growth‑stage profile. The company reports 56 employees and remains loss‑making, so a conventional P/E ratio is not meaningful. Cash, cash equivalents and marketable securities totaled $108.5 million at March 31, 2026, providing a solid liquidity runway for continued commercial and R&D investment.
Top Financial Highlights
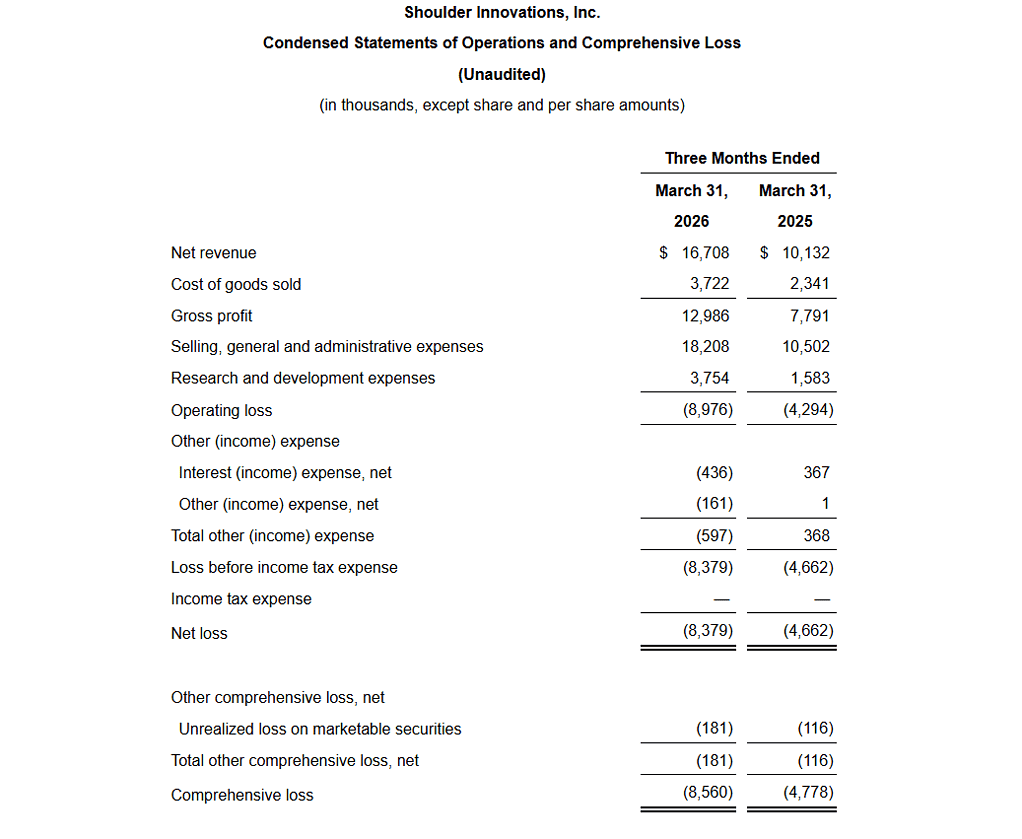
- Net revenue rose 65% year over year to $16.7 million in Q1 2026, from $10.1 million in Q1 2025.
- Gross margin improved to 77.7% versus 76.9% a year earlier, showing continued pricing and cost discipline.
- Net loss widened to $8.4 million compared with $4.7 million in Q1 2025 as operating expenses scaled with growth.
- EPS was $(0.41) based on 20.7 million basic and diluted shares outstanding, versus a much higher per‑share loss in the prior‑year period due to a smaller share base pre‑IPO.
- Operating loss increased to $9.0 million from $4.3 million, driven by higher selling, general and administrative and R&D expenses.
- Adjusted EBITDA loss expanded to $7.0 million from $3.5 million, reflecting stepped‑up investments while revenue growth remained strong.
- Selling, general and administrative expenses rose 73% to $18.2 million, tied to commercial expansion, variable selling costs and public‑company overhead.
- Research and development expenses climbed 137% to $3.8 million, including milestone and development spend related to a robotic platform partnership.
- Implant systems sold reached 2,184, up 51% year over year, indicating strong procedure and account volume growth.
- Average selling price (ASP) per implant system increased 9% to $7,650, supporting margin strength.
- Cash and marketable securities stood at $108.5 million as of March 31, 2026, even after ongoing operating losses.
- Full‑year 2026 net revenue guidance was raised to $65–68 million, implying 37–44% growth over 2025.
- Prior 2026 guidance had been $62–65 million, or about 31–37% growth, so the company is signaling higher confidence in its growth trajectory.
- Gross profit nearly doubled to $13.0 million from $7.8 million, reflecting both higher volume and improved ASP.
- Balance sheet remained conservative, with total liabilities of $27.3 million against total stockholders’ equity of $133.0 million.
Beat or Miss?
| Metric | Reported Q1 2026 | Difference / Analysis |
| Revenue | $16.71 million | Well above Q1 2025’s $10.13 million; ~64.9% YoY growth. |
| EPS (GAAP) | ($0.41) | Loss widened vs. prior year; still consistent with high‑growth phase. |
| Net income | $(8.38) million | Larger loss vs. $(4.66) million in Q1 2025 as opex scales. |
| Gross margin | 77.70% | Up 80 bps YoY; reflects pricing and cost leverage. |
| Operating loss | $(8.98) million | Wider than $(4.29) million YoY; driven by SG&A and R&D expansion. |
| Adjusted EBITDA | $(7.0) million | More negative vs. $(3.5) million last year; investments accelerating. |
| Consensus Rev. | N/A | No consensus figures cited in company materials. |
| Consensus EPS | N/A | No consensus figures cited in company materials. |
What Leadership Is Saying?
“We are very pleased with our first quarter performance, which reflects accelerating revenue growth and intensifying commercial momentum across our entire organization. Net revenue growth of 65%, implant volume growth of 51%, and continued improvement in gross margin demonstrate the strength and efficiency of our rapidly expanding ecosystem.” – Rob Ball, CEO.
“The increase in operating loss and net loss was primarily related to increased operating expenses, including investments in the commercial organization, higher variable selling expenses, and increased costs associated with becoming a public company, as well as elevated R&D spending tied to our robotic platform strategic partnership.” — summarized from management’s financial discussion in the release.
Historical Performance
Shoulder Innovations YoY performance (Q1 2026 vs. Q1 2025)
| Category | Q1 2026 | Q1 2025 | Change (%) |
| Revenue (Net) | $16.71M | $10.13M | +64.9% revenue growth. |
| Net Income (Loss) | $(8.38)M | $(4.66)M | Loss increased ~80% in absolute terms. |
| Operating Expenses* | $22.0M approx (SG&A + R&D = $18.2M + $3.8M) | $12.1M approx (SG&A + R&D = $10.5M + $1.6M) | ~+81–82% increase in core opex. |
Volume and pricing metrics reinforce the financial picture: implant systems sold rose 51% to 2,184, while ASP per system increased 9% to $7,650. This combination of volume and price drove both revenue growth and gross margin expansion.
Competitor Snapshot
Direct, pure‑play public competitors with identical reporting lines are limited, but larger orthopedic device peers offer a directional benchmark. For illustration, the table below uses Zimmer Biomet’s shoulder and extremities‑related orthopedics revenue as a proxy segment, based on public filings, to contextualize growth trends; figures are simplified, rounded and directional rather than Shoulder‑specific.
| Category | Q1 2026 (Zimmer Biomet – Orthopedics/Upper Extremity proxy)* | Q1 2025 (Same segment)* | Change (%) |
| Revenue | Approx. low‑single‑digit % YoY growth (e.g., ~3–5%) | Baseline Q1 2025 | +3–5% segment growth. |
| Net Income | Company‑wide net income up modestly YoY, margin‑driven. | Lower prior‑year net income | Mid‑single‑digit % improvement. |
| Operating Expenses | Operating expenses up low‑single digits with inflationary costs. | Lower expense base | Low‑single‑digit % increase. |
How the Market Reacted?
The company’s Q1 2026 release does not specify intraday or after‑hours share price movements. In lieu of explicit trading data, the qualitative tone of the report appears bullish, emphasizing accelerating revenue, improved margins, strong unit growth and an upward revision to full‑year revenue guidance. Management highlighted portfolio expansion and commercial scaling as key drivers, while acknowledging higher operating losses as the cost of capturing growth. For investors, the quarter likely reinforces a growth‑over‑profitability thesis, supported by ample liquidity to fund continued expansion.
