








Quick Verdict
VersaBank reported Q3 fiscal 2026 diluted EPS of C$0.31 and record revenue of C$38.8 million, up 23% year over year. Although reported EPS and revenue fell short of published consensus comparisons, rapid U.S. Structured Receivable Program growth lifted net income 53%; shares rose sharply in the September 3 session.
About VersaBank
VersaBank (TSX: VBNK; Nasdaq: VBNK) is a London, Ontario-headquartered digital bank founded in 1993 by David Roy Taylor. It operates a branchless, business-to-business banking model in Canada and the United States, sourcing most deposits and funding electronically through financial-intermediary partners. Its core banking activity includes structured receivable funding, commercial real estate lending, and other credit products, while its technology businesses include Digital Meteor and DRT Cyber Inc. (DRTC), which provides cybersecurity services and digital-asset technology.
The company’s Q3 fiscal 2026 results underline how its growth is increasingly tied to the U.S. Structured Receivable Program (SRP), formerly called the Receivable Purchase Program. VersaBank reported C$6.88 billion in total assets as of July 31, subsequently surpassing C$7 billion. Based on the Nasdaq-listed share quote available following the release, VBNK had a market capitalization of about US$665.3 million, a P/E ratio of 29.44x, and a dividend yield of 0.31%. The quarterly dividend declared separately was C$0.025 per common share.
Top Financial Highlights
- Consolidated revenue reached a record C$38.8 million, up 23% year over year and 1% sequentially.
- Net income increased 53% to C$10.1 million, compared with C$6.6 million in Q3 fiscal 2025.
- Reported basic and diluted EPS was C$0.31, up from C$0.20 a year earlier, a 55% increase.
- Adjusted/core net income rose 27% year over year to C$12.3 million; adjusted/core EPS was C$0.38, versus C$0.30 in the prior-year quarter.
- Net interest income rose to C$36.8 million from C$29.8 million, while non-interest income increased to C$2.0 million from C$1.8 million.
- Total assets rose 26% year over year and 7% quarter over quarter to a record C$6.88 billion; management said assets exceeded C$7 billion after quarter-end.
- Combined Digital Banking credit assets reached a record C$6.16 billion, up 29% year over year and 9% sequentially.
- Combined Canadian and U.S. SRP portfolios increased 40% year over year and 11% sequentially, supporting the bank’s credit-asset expansion.
- Digital Banking Canada generated C$27.6 million in revenue and C$6.6 million in net income.
- Digital Banking USA generated C$9.3 million in revenue and C$3.9 million in net income, up sharply from C$437,000 in Q3 fiscal 2025.
- Digital Meteor contributed C$413,000 in revenue and C$114,000 in net income; DRTC generated C$1.88 million in revenue but recorded a C$578,000 net loss.
- Total non-interest expenses were C$25.2 million, including C$3.1 million of non-core costs: C$2.5 million for the proposed corporate reorganization and C$600,000 from a capitalized software write-off related to the U.S. branch-assets sale.
- VersaBank recorded a C$229,000 recovery of credit losses, compared with a C$1.18 million provision a year earlier; the provision/recovery rate was negative 0.02% of average credit assets.
- Overall net interest margin was 2.19%, down from 2.25% a year ago, while NIM on credit assets was 2.44%, down from 2.55%. The decline reflected funding costs, higher liquidity, changes in deposit composition, and loan-mix effects.
- The CET1 capital ratio was 11.47%, total capital ratio was 13.32%, and leverage ratio was 7.64% at quarter-end.
- VersaBank did not disclose a conventional “cash on hand” figure in the earnings release; for banks, total assets, liquidity securities, deposit funding, and regulatory capital ratios generally offer a more relevant liquidity and solvency view than corporate cash alone.
- For fiscal 2027, management targeted at least US$3 billion—more than C$4 billion—of additional U.S. SRP funding on its own balance sheet, with potential upside. An ECN Capital subsidiary arrangement is expected to add at least US$300 million of annual U.S. SRP funding and could exceed US$500 million over time.
Financial Summary
(Source: newsfilecorp.com)
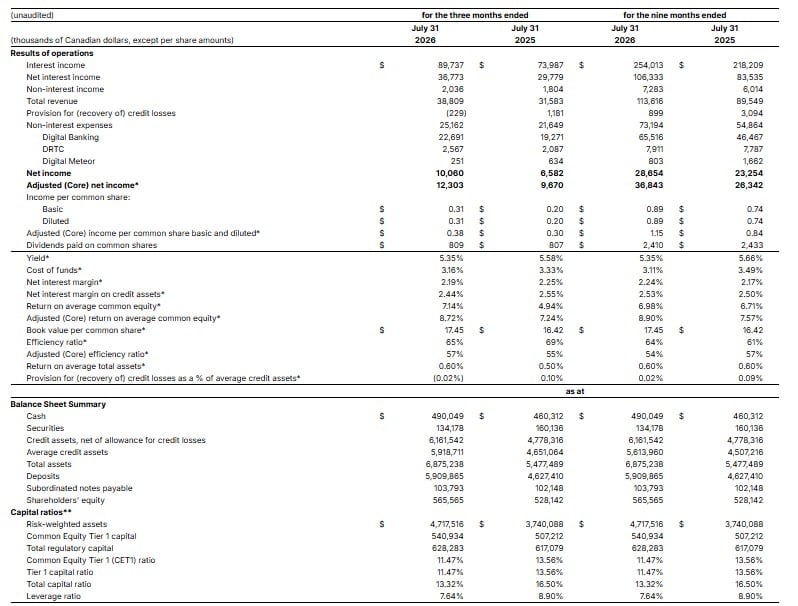
- The Table presents the company’s unaudited financial results, balance sheet position, and capital ratios for the three months and nine months ended July 31, 2026, compared with the corresponding periods in 2025. Figures are reported in thousands of Canadian dollars, except per-share amounts and ratios.
- For the three months, total revenue increased to CAD 38.8 million from CAD 31.6 million, supported by net interest income of CAD 36.8 million. Net income rose to CAD 10.1 million, compared with CAD 6.6 million in the prior-year quarter, while adjusted core net income increased to CAD 12.3 million from CAD 9.7 million. Basic and diluted EPS improved to CAD 0.31 from CAD 0.20, while adjusted core EPS increased to CAD 0.38 from CAD 0.30.
- For the nine months, total revenue reached CAD 113.6 million, up from CAD 89.5 million in 2025. Net income increased to CAD 28.7 million from CAD 23.3 million, while adjusted core net income rose to CAD 36.8 million from CAD 26.3 million.
- The balance sheet also expanded, with total assets increasing to CAD 6.88 billion from CAD 5.48 billion. Credit assets rose to CAD 6.16 billion, while deposits increased to CAD 5.91 billion from CAD 4.63 billion. Shareholders’ equity strengthened to CAD 565.6 million.
- Capital levels remained above 11% for the Common Equity Tier 1 and Tier 1 ratios, although both declined to 11.47% from 13.56% a year earlier. The total capital ratio also decreased to 13.32% from 16.50%.
- Overall, the table indicates stronger revenue, earnings, credit-asset growth, and deposit expansion in 2026, alongside lower year-over-year regulatory capital ratios.
Beat or Miss?
VersaBank’s operational figures were strong, but its reported quarterly EPS and revenue were below the third-party consensus comparison published with the earnings-call transcript. The comparison is not a company-provided forecast and is shown accordingly.
| Metric | Reported | Difference/Analysis |
| Revenue | C$38.81 million | Reported consensus comparison characterized revenue as C$1.25 million below estimates. |
| Adjusted/core EPS | C$0.38 | Reported consensus comparison characterized adjusted EPS as C$0.01 below estimates. |
| GAAP/IFRS reported EPS | C$0.31 | Up 55% from C$0.20 in Q3 fiscal 2025; no separate consensus figure was identified for this measure. |
| Net income | C$10.06 million | Up 53% year over year; reported net income included C$3.1 million of non-core costs. |
| Adjusted/core net income | C$12.30 million | Up 27% year over year; down 1% sequentially from C$12.38 million. |
| Forward U.S. SRP target | At least US$3 billion in new fiscal-2027 funding | Management target, not analyst consensus. It signals continued aggressive U.S. balance-sheet growth. |
What Leadership Is Saying
David Taylor, VersaBank’s founder and president, framed the quarter as evidence that the bank’s U.S. SRP strategy and digital operating model are translating into operating leverage:
“The third quarter once again saw new records for credit assets, revenue and net interest income, with strong year-over-year growth driven by the continuing strong momentum in our Structured Receivable Program in the United States, as well as steady growth in Canada.”
“As we achieve this expected growth in credit assets and revenue in fiscal 2027, we expect to really see the benefit of the operating leverage. To even further capitalize on our operating leverage, we are undertaking numerous AI-based initiatives across the broader organization to drive even greater efficiency as we grow, while further strengthening our risk profile.”
Historical Performance
Consolidated year-over-year performance
| Category | Q3 Fiscal 2026 | Q3 Fiscal 2025 | Change (%) |
| Revenue | C$38.81 million | C$31.58 million | 23% |
| Net income | C$10.06 million | C$6.58 million | 53% |
| Net interest income | C$36.77 million | C$29.78 million | 24% |
| Non-interest expenses | C$25.16 million | C$21.65 million | 16% |
| Adjusted/core net income | C$12.30 million | C$9.67 million | 27% |
| Diluted EPS | C$0.31 | C$0.20 | 55% |
| Total assets | C$6.88 billion | C$5.48 billion | 26% |
(Source: VersaBank Q3 fiscal 2026 financial summary.)
Segment performance: Q3 Fiscal 2026 vs. Q3 Fiscal 2025
The requested competitor comparison is not directly applicable to a quarterly earnings release because VersaBank does not report financial results for external competitors. To preserve factual integrity, the table below compares VersaBank’s main operating businesses—the closest useful equivalent available in the disclosed information.
| Category | Q3 Fiscal 2026 | Q3 Fiscal 2025 | Change (%) |
| Digital Banking Canada revenue | C$27.57 million | C$26.62 million | 4% |
| Digital Banking USA revenue | C$9.30 million | C$3.12 million | 199% |
| Digital Meteor revenue | C$0.41 million | C$0.62 million | -34% |
| DRTC cybersecurity revenue | C$1.88 million | C$1.57 million | 20% |
| Digital Banking Canada net income | C$6.58 million | C$6.52 million | 1% |
| Digital Banking USA net income | C$3.95 million | C$0.44 million | 803% |
| Digital Meteor net income | C$0.11 million | C$0.02 million | 396% |
| DRTC net loss | C$(0.58) million | C$(0.40) million | Loss widened 45% |
The U.S. Digital Banking business is the standout growth engine, with revenue nearly tripling and net income expanding from C$437,000 to C$3.95 million. By contrast, DRTC’s higher revenue did not yet offset increased expenses, leaving the cybersecurity operation loss-making for the quarter.
How the Market Reacted?
The immediate trading narrative was somewhat mixed across sources, but the more complete post-release session data point to a positive net reaction. VBNK reportedly gained 6.79% on September 3, with an intraday peak move of 11.1% and exceptionally high volume of roughly 115.3 times the daily average, indicating considerable investor attention after the release.
By September 4, Nasdaq-listed VBNK closed at US$22.41, up 8.84% for that session, while MarketWatch listed a market capitalization of approximately US$665.3 million. Investors appear to have focused on record assets, 53% net-income growth, expanding U.S. SRP activity and the fiscal-2027 U.S. funding target, while still weighing the modest revenue/EPS shortfall against consensus comparisons and the year-over-year compression in net interest margin.



