
Introduction
Email marketing statistics: Email marketing is the blueprint for a successful digital strategy in 2025. They tell us precisely where to invest our effort, whether it’s in optimizing for mobile, segmenting our lists, or automating a high-value cart abandonment series. Email Marketing isn’t just a key pillar of your strategy; for many businesses, it’s the primary driver of revenue that offers a verifiable, unmatched return on investment ROI.
Think about it: I’ve been in this industry for a long time, and the one constant has been the inbox. It’s a direct, private channel that has survived every social media wave and algorithm change, and the data absolutely prove its resilience and growth. Let’s get into the stats.
Editor’s Choice
- Email Marketing is the most cost-effective channel, yielding an average Return on Investment ROI of $42 for every $1 spent, confirming its status as a primary revenue generator.
- The average email open rate across industries is approximately 24%, and the average click-through rate CTR is around 3.5%.
- A vast majority of email users 99% check their inboxes every single day.
- 80% of marketers rate email as their top channel for customer retention.
- Segmentation, grouping subscribers by behavior, demographics, or purchase history, can boost overall campaign revenue by 760%.
- Personalized emails deliver transaction rates that are six times higher than non-personalized batch-and-blast emails.
- Personalizing the subject line alone can increase open rates by up to 26%.
- 58% of all email revenue is generated by highly targeted, segmented, and personalized emails.
- The majority of engagement happens on the go, with 60% to 62% of all emails being opened on a mobile device.
- Approximately 50% of recipients will immediately delete an email if it is not properly formatted and optimized for mobile viewing, underscoring the necessity of a mobile-first design approach.
- Automated email sequences, such as welcome, abandoned cart, and post-purchase emails, generate up to 320% more revenue per email than standard, one-off newsletters.
- Welcome email sequences are the highest-performing automated campaigns, boasting average open rates of around 50% to 68.6%.
- Abandoned Cart emails are one of the most profitable emails, achieving an average open rate of 39% to 51% and a conversion rate typically between 10% and 15%.
- Sending the first abandoned cart recovery email within 1 hour of abandonment significantly boosts the chances of conversion.
- Emails that feature a single, clear Call-to-Action CTA can generate a 371% higher click-through rate than those with multiple, competing options.
- For business audiences, 77% of B2B buyers prefer to be contacted via email for content distribution and sales follow-ups over other channels.
Global User Growth and Volume
 (Reference: influencermarketinghub.com)
- The global user base for email is projected to reach an incredible 4.59 billion people by the end of 2025, confirming its status as the most pervasive digital communication channel worldwide, and this number is forecast to climb further to 4.73 billion in 2026.
- The daily volume of electronic mail is staggering, with an estimated 376.4 billion emails sent and received every single day in 2025, which represents a robust compound annual growth rate CAGR of about 4%.
- In the competitive email client space, Apple Mail currently dominates, holding the largest market share globally at over 51.52%, while Google’s Gmail follows with a considerable 26.72% share, making optimization for these two clients critical for deliverability and presentation.
- Despite the colossal volume, an overwhelming 99% of email users report checking their inbox at least once per day, and a significant portion check it multiple times, often up to 20 times a day, highlighting the channel’s role in daily routines and immediate accessibility.
- The commercial market built around this channel is growing rapidly, with the global email marketing revenue projected to hit an astounding $13.69 billion in 2025 and is on track to reach $17.9 billion by 2027.
| Global Email Users Projected | 4.59 Billion |
| Daily Email Volume Projected |
376.4 Billion |
|
Top Email Client Market Share |
Apple Mail at 51.52% |
| User Check Frequency |
99% check daily |
|
Market Revenue Projected |
$13.69 Billion |
The Return on Investment Email Marketing ROI
 (Reference: emailtooltester.com)
- The widely accepted industry average for Email Marketing ROI is a massive $42 return for every $1 spent on campaigns, a 4200% return that solidifies its position as the most cost-effective tool in the digital marketing landscape.
- This ROI figure is not uniformly distributed, as high-achieving businesses report even better results, with 18% of marketers claiming they achieve an ROI of over $70 for every $1 spent by focusing on sophisticated automation and high-level segmentation.
- A significant 87% of B2B marketers now consider email marketing an essential or critical tool for their business success, with 75% of agency respondents and 73% of company respondents rating it as an excellent digital channel for ROI generation.
- Implementing simple A/B split testing on campaigns is proven to generate significantly higher returns, with marketers who actively test their emails reporting an ROI of $42 for every $1 spent, compared to just $21 for those who neglect to test.
- The data clearly shows that email traffic is an elite converter, driving 4.24% of website traffic to a purchase, which dramatically outperforms both organic search traffic at 2.49% and social media traffic at a mere 0.59%.
| Average ROI | $42 for every $1 spent |
| High Achievers’ ROI | $70+ for every $1 spent |
| Purchase Conversion Rate | 4.24% from email traffic |
| Marketer Confidence | 87% of B2B marketers deem it critical |
| Value of A/B Testing | Doubles ROI from $21 to $42 per dollar |
Email Marketing Market Size
 (Source: market.us)
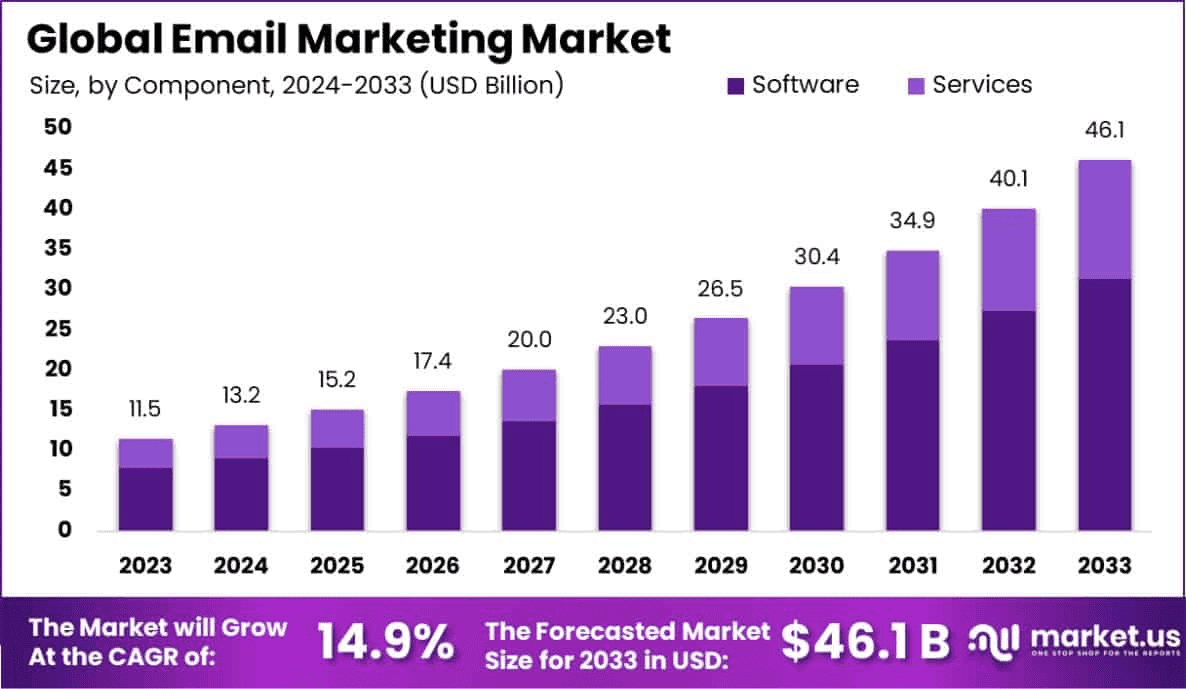
- According to market.us, the overall market value of email marketing is projected to grow from $13.2 billion in 2024 to an estimated $46.1 billion by 2033, demonstrating strong, long-term growth.
- This expansion represents a vigorous Compound Annual Growth Rate CAGR of 14.9% across the entire forecast period, from 2024 to 2033.
- The channel’s profitability remains exceptionally high, generating an average Return on Investment ROI of $42 in revenue for every $1 marketing dollar spent.
- In terms of the Component segment share in 2023, Software dominated the market, commanding a share of over 68.1% as businesses increasingly adopt automation tools.
- Regarding the Deployment Mode in 2023, Cloud-based solutions were the clear leader, capturing more than 70.5% of the market share due to their flexibility and scalability.
- By Organization Size in 2023, Large Enterprises held the largest market share, accounting for more than 64.0% as they invest in complex and high-volume email campaigns.
- The Retail and E-commerce sectors were the largest industry consumers of email marketing in 2023, accounting for 21.9% of the total market share.
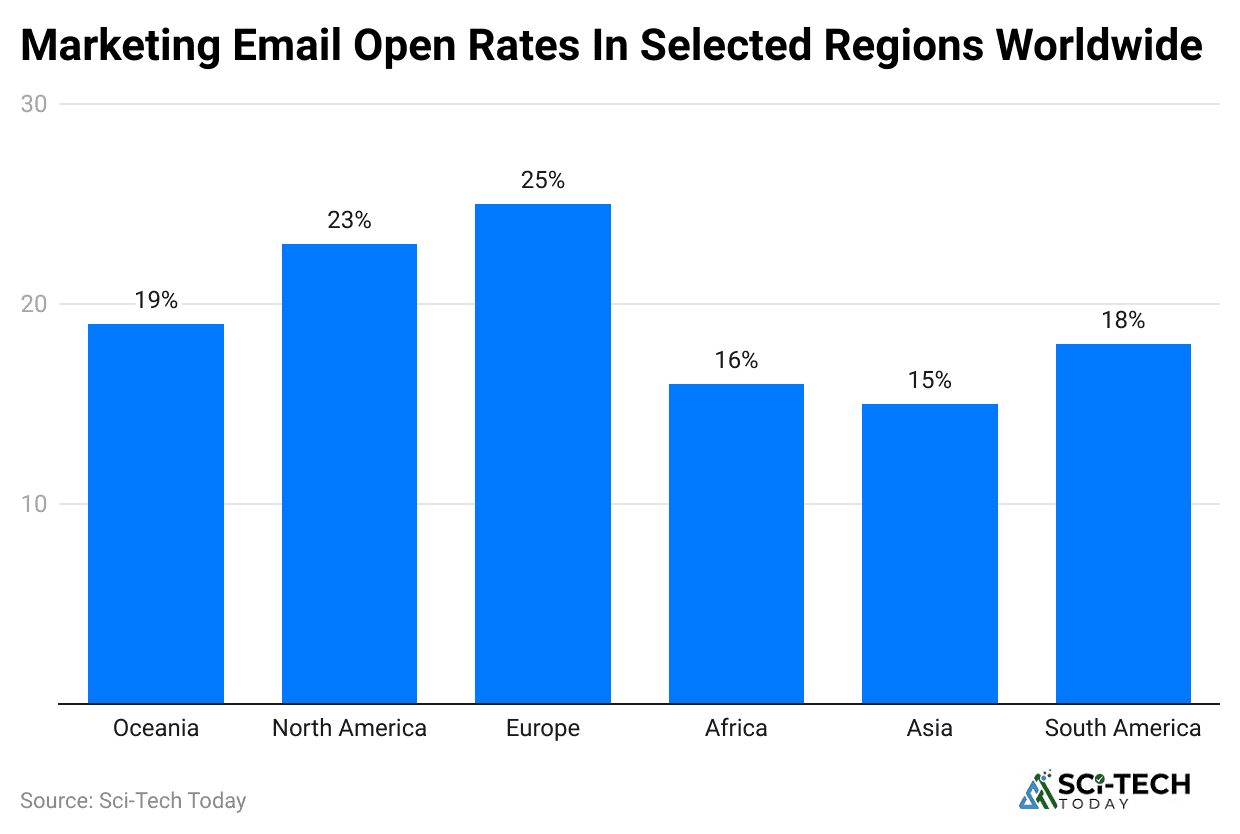
- North America maintained its leading regional position in the global market in 2023, holding a significant 36.3% of the market share.
- This dominance translated to a North American market valuation of USD 4.17 billion in 2023, highlighting the region’s strong investment in marketing technology.
- Email campaigns show healthy engagement with an average open rate of 21.33% and a strong average Click-Through Rate CTR of 2.62%.
- The strategic use of Calls-to-Action CTAs within emails is highly effective, leading to a massive 371% increase in click-through rates.
- Furthermore, CTAs also deliver a substantial impact on conversion, resulting in a dramatic 1617% rise in overall sales from email marketing efforts.
- Abandoned cart emails are exceptionally effective for revenue recovery, boasting an impressive average open rate of 45%.
- These high-intent recovery emails also achieve a strong conversion pipeline, with an average click-through rate CTR of 21%.
Digital Marketing Outsourcing Market Data
 (Source: grandviewresearch.com)
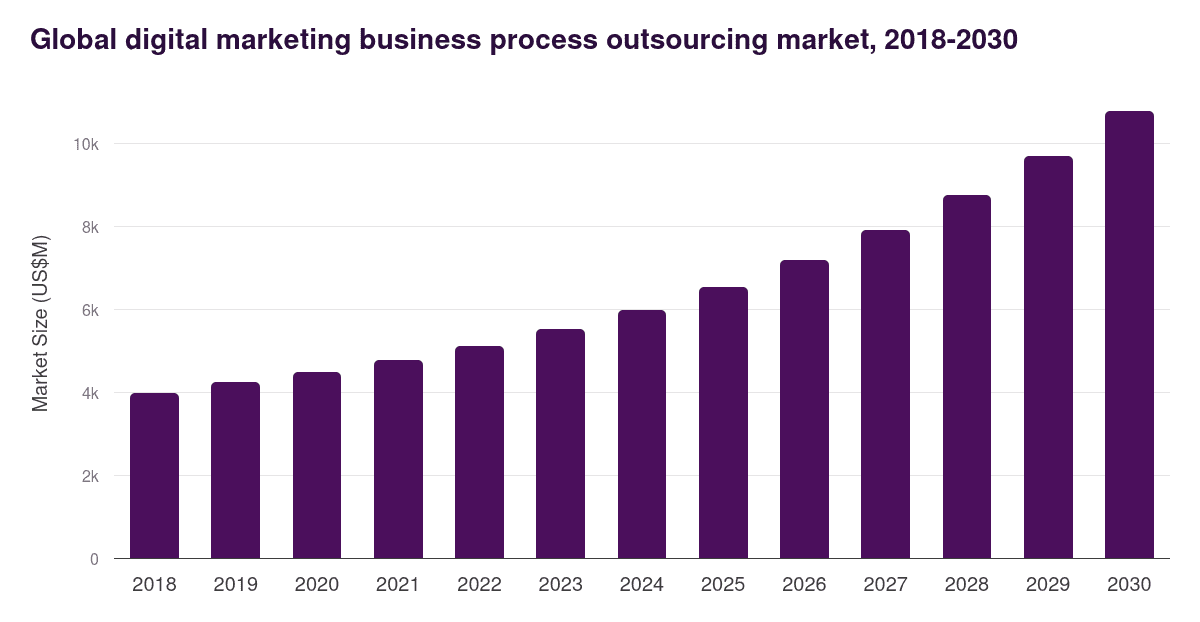
- The digital marketing outsourcing market is projected to grow from $28.3 billion in 2025 to a massive $74.76 billion by 2034.
- This forecast represents a strong overall Compound Annual Growth Rate CAGR of 11.4% across the period from 2025 to 2034.
- The Digital Marketing service segment itself dominated the market in 2024, capturing a leading share of more than 53.7% of the total outsourced value.
- By industry, the IT & Telecommunications sector was the primary driver of demand in 2024, accounting for over 23.8% of the market share.
- The US market is projected to continue with high demand, expected to reach a value of USD 8.82 billion by the year 2034.
- The US market is set to grow at a steady CAGR of 10.3% through the forecast period, reflecting consistent reliance on outsourced expertise.
- North America led all global regions in 2024, holding a dominant global market share of 38.6%.
- North America’s regional revenue contribution in 2024 was approximately USD 9.8 billion, underscoring its significant role in the global outsourcing economy.
- The importance of outsourcing to large corporations is clear, with 92% of G2000 companies utilizing IT outsourcing services.
- Outsourcing is not limited to large firms; about 37% of small businesses rely on external partners to manage at least one business function.
- Outsourcing represents a crucial economic engine for some nations, with the industry accounting for 9% of the Philippines’ national GDP.
- As a global service hub, China’s outsourcing sector is expanding rapidly, welcoming over 1 million new outsourcing employees annually.
| Market Size Start Year | $13.2 Billion in 2024 | $28.3 Billion in 2025 |
| Market Size End Year | $46.1 Billion by 2033 | $74.76 Billion by 2034 |
| CAGR Growth Rate | 14.9% 2024 to 2033 | 11.4% 2025 to 2034 |
| Cost-Effectiveness/ROI | Generates $42 in revenue for every $1 spent. | 92% of G2000 companies utilize IT outsourcing to reduce costs. |
| Component/Service Dominance | Software dominated in 2023, with over 68.1% of the share. | Digital Marketing segment dominated in 2024, with more than 53.7% of the share. |
| Deployment Mode | Cloud-based solutions led in 2023, capturing more than 70.5% of the share. | Not specified in the provided data. |
| Organization Size | Large Enterprises captured more than 64.0% of the share in 2023. | 37% of small businesses outsource at least one function. |
| Top Industry/Sector | Retail and E-commerce accounted for 21.9% of the share in 2023. | IT & Telecommunications led the market in 2024, with over 23.8% of the share. |
| North America Market Share | Led the global market in 2023 with 36.3% share USD 4.17 billion. | Led the global market in 2024 with 38.6% share USD 9.8 billion. |
| Key Performance Metrics General | Average Open Rate: 21.33% / Average CTR: 2.62%. | The US market is expected to reach USD 8.82 billion by 2034 with a CAGR of 10.3%. |
| Key Performance Metrics CTAs | Use of CTAs resulted in a 371% increase in click-throughs and a 1617% rise in sales. | Not specified in the provided data. |
| Key Performance Metrics Abandoned Cart | Abandoned cart emails have a 45% open rate and a 21% click-through rate. | Not specified in the provided data. |
| Global Economic Impact | Not specified in the provided data. | China’s sector adds over 1 million new employees annually; the Philippines accounts for 9% of the national GDP. |
Open Rates, CTR, and the Power of Email Type
 (Reference: tidio.com)
- The global average email open rate across all industries currently hovers around 21.33%, though sophisticated email lists and hyper-niche industries can push this average up to 35.63% or even higher for specific segments.
- Welcome emails remain the gold standard for engagement, boasting an average open rate of 54.3% in the e-commerce sector and sometimes soaring as high as 68.6%, which confirms their role as a critical first impression for new subscribers.
- Abandoned cart emails are not just opened; they are immensely profitable, generating the highest Revenue Per Recipient RPR at an average of $3.65, and they also see a spectacular average open rate of 51% across all sectors.
- The average click-through rate CTR for an email marketing campaign across industries sits around 2.03% to 2.62%, which means a healthy list should be driving 20 to 26 clicks for every 1,000 messages delivered to the inbox.
- The Click-to-Open Rate CTOR, which measures engagement after the email is opened, averages about 5.63% in B2B technology, but industries with highly engaging content, like media, can see this rate hit 10.71%.
| Welcome Emails | 54.3% to 68.6% | 5.8% | Highest RPR $3.65 |
| Abandoned Cart Emails | 51% | 6% | Highest Conversion Rate 10 to 15% |
| All Industries Average | 21.33% to 35.63% | 2.03% to 2.62% | 5.63% B2B Tech |
| B2B Services | 41.7% | 2.21% | N/A |
| E-commerce / Retail | 29.81% to 38.58% | 1.74% to 1.34% | 4.55% |
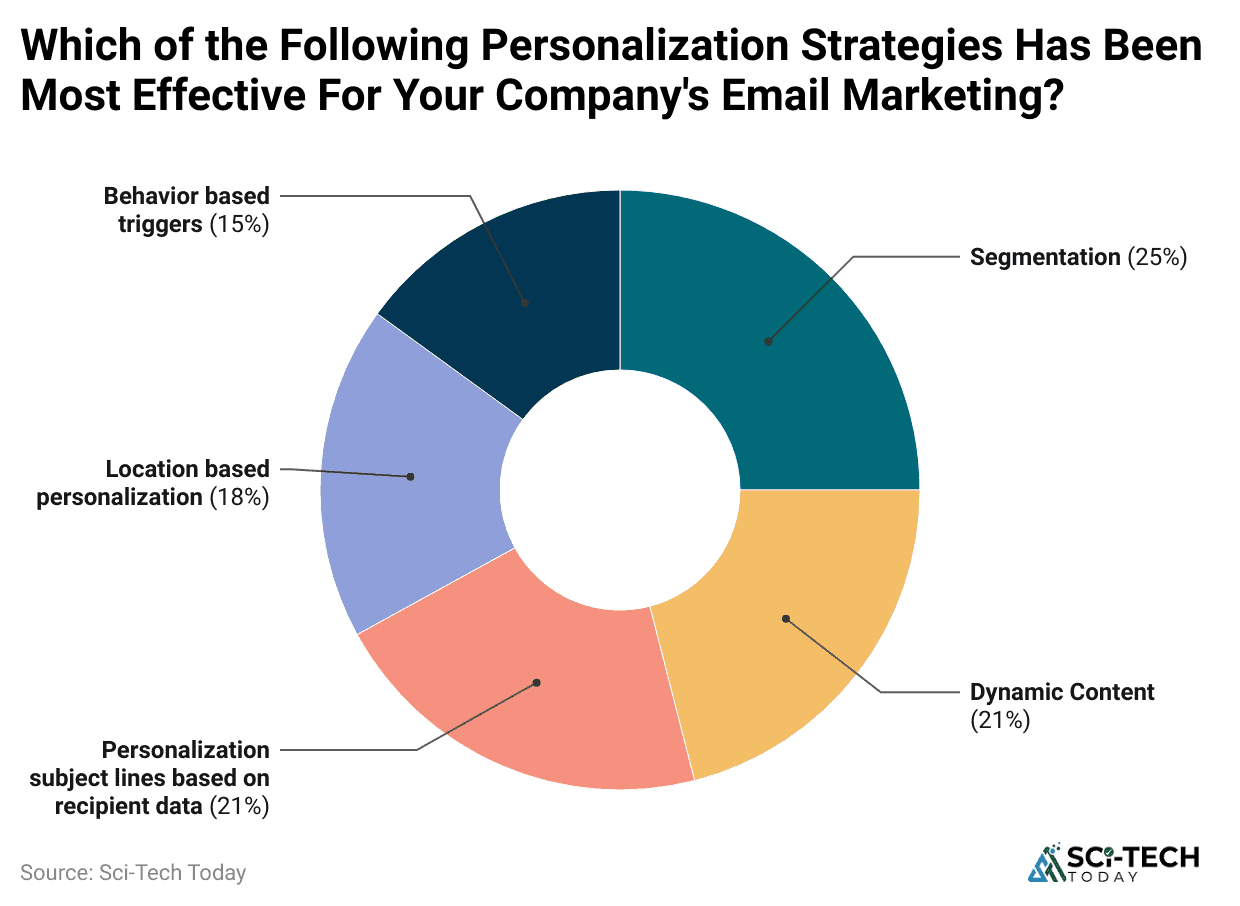
Segmentation, Personalization, and Subject Lines
 (Reference: litmus.com)
- Email list segmentation is perhaps the most powerful strategic lever, with marketers who utilize it capable of boosting campaign revenue by a monumental 760%, proving that sending the right message to the right person is vastly more effective than mass outreach.
- Automated, personalized emails, which are tailored based on purchase history, browsing behavior, or demographics, deliver transaction rates that are six times higher than generic, non-personalized batch-and-blast emails.
- Simply adding a customer’s name or a personalized element to the subject line can increase the email open rate by a significant margin, with personalized subject lines achieving a 26% higher open rate than their generic counterparts.
- When it comes to the body of the email, automated campaigns that rely on triggers and behavioral data are the high-performers, generating a massive 320% more revenue than campaigns that are sent manually without automation.
- A key finding for maximizing click performance is to maintain focus: emails that contain a single, clear Call-to-Action CTA have been shown to generate a 371% higher click-through rate than emails that confuse the reader with multiple, competing action items.
| Revenue Increase via Segmentation | 760% |
| Transaction Rate from Personalization | 6x higher |
| Open Rate with Personalized Subject Line | 26% higher |
| Revenue from Automation | 320% more |
| Single CTA CTR Increase | 371% higher |
Email Marketing On The Go
 (Source: blog.hubspot.com)
- A dominant share of all messages is opened on a small screen, with approximately 60% to 62% of all emails being opened and interacted with on a mobile device, effectively making mobile the single most important reading environment globally.
- In the United States, this trend is even more pronounced, with an estimated 90% of all online users checking their email using a mobile device, a statistic that highlights the necessity of a mobile-first design philosophy for US audiences.
- Neglecting mobile optimization carries a steep penalty, as up to 50% of people will immediately delete an email that is not properly formatted and easy to read on their mobile phone, representing a massive loss in potential engagement and revenue.
- Simply using a mobile-responsive email design, one that fluidly adapts to screen size, can increase the unique mobile click-through rate of an email by a considerable 15%, demonstrating the direct revenue impact of thoughtful design.
- The mobile environment also necessitates brevity: data suggests that emails under 200 words long are the most likely to be fully engaged with, forcing marketers to prioritize concise, scannable, and valuable content over lengthy text blocks.
| Emails Opened on Mobile | 60% to 62% |
| Mobile Optimization Penalty | 50% deletion rate |
| CTR Increase from Responsive Design | 15% unique mobile clicks |
| Ideal Email Length | Under 200 words |
| US Mobile Usage | 90% of US online users check on mobile |
B2B vs. B2C Email Marketing
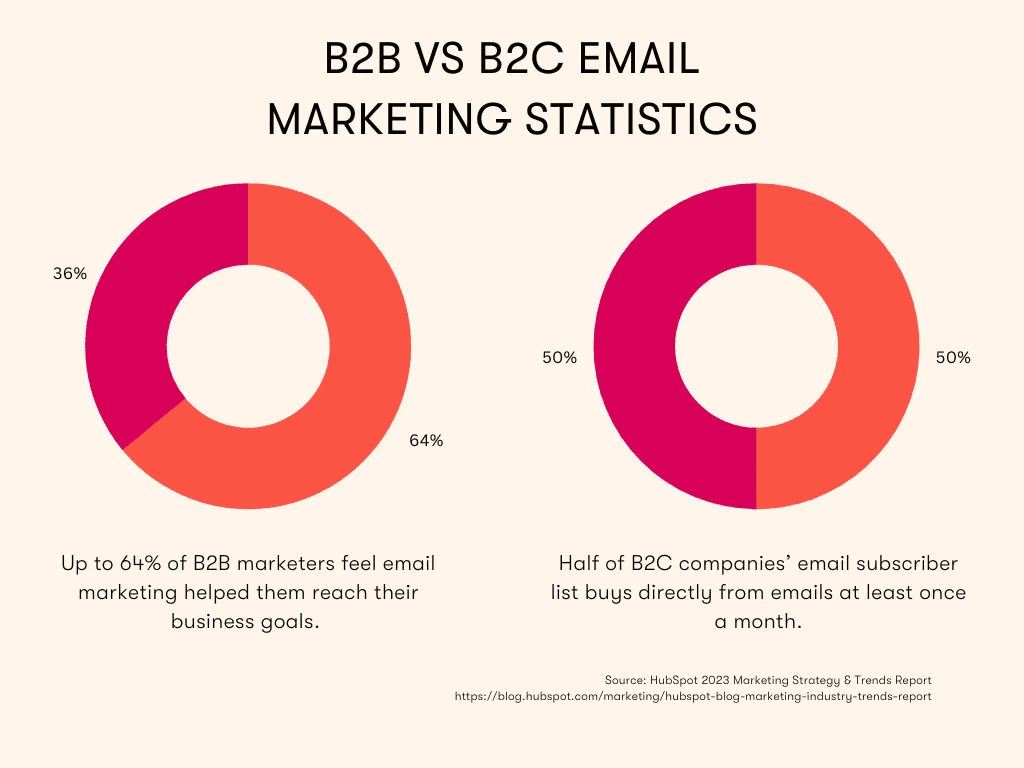 (Source: mayple.com)
B2B Email Marketing Statistics
- B2B buyers overwhelmingly prefer email, with a commanding 77% of B2B customers stating they prefer to be contacted and nurtured via email over any other communication channel, including phone or social media.
- Email Newsletters are the top content distribution method for B2B, with 73% of B2B marketers actively using newsletters as part of their overall content marketing strategy to nurture leads and build thought leadership.
- The most crucial metric for B2B marketers when evaluating content performance is email engagement, with 71% of marketers citing it as a key metric, second only to overall conversions 73%, demonstrating its value as a lead-scoring indicator.
- B2B content marketers rely on email heavily for lead generation, with 89% of B2B organizations using email marketing to effectively distribute their various content assets, such as white papers, case studies, and webinars.
- The Click-to-Open Rate CTOR for B2B emails is measurably higher than B2C, demonstrating that once a professional opens a message, they are more focused and likely to click a link, resulting in a higher quality of engagement.
B2C Email Marketing Statistics
- Consumer purchase decisions are heavily influenced by email marketing, as 59% of consumers report that marketing emails have directly influenced a purchase they made, showing a strong link between the inbox and the cash register.
- A significant portion of the consumer base is actively buying directly from their inbox, with over 52% of people reporting that they have made a purchase directly from an email newsletter at least once in the past year.
- In the e-commerce space, abandoned cart emails continue to be a powerhouse, with conversion rates typically ranging between 10% and 15%, making this automated flow one of the highest-converting assets a B2C brand can deploy.
- To compete in the crowded B2C inbox, many brands are integrating multi-channel approaches; e-commerce brands, for instance, sent 75% more SMS messages in 2021 than in 2020, blending SMS into the sales funnel for immediate, high-urgency notifications.
- When evaluating marketing channel effectiveness, Email Marketing ties with both websites/SEO and paid social media at 14% for driving the highest overall ROI for B2C brands, solidifying its position among the top three revenue generators.
| Customer Preference | 77% prefer email contact | 59% influenced their purchase |
| Primary Tool | 73% use Email Newsletters | 52% buy from Newsletters |
| Engagement Indicator | 71% track email engagement | 10 to 15% Abandoned Cart Conversion |
Deliverability and Automation
 (Reference: mailerlite.com)
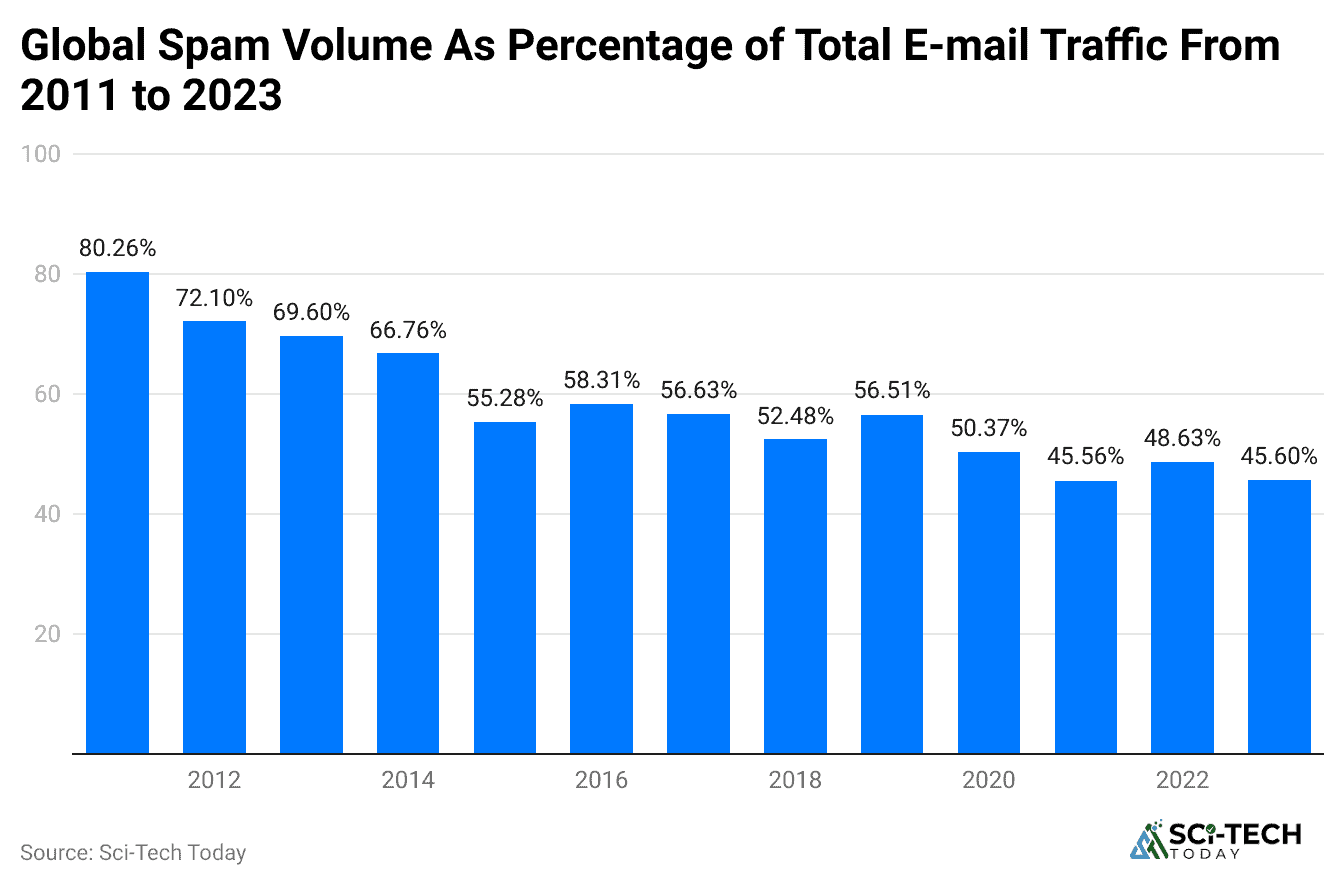
- The average email deliverability rate sits around 81% across the board, which means that nearly 19% of all commercial emails are either going missing entirely or are being caught by various spam filters, representing a significant loss of audience reach and potential revenue.
- Deliverability rates vary dramatically by service provider: in a Q2 2025 analysis, certain major inbox providers like Gmail saw an average inbox rate of 56.27%, while others struggled to break the 50% mark, emphasizing the need to monitor performance on each specific provider.
- For high-volume senders, the challenge is amplified: senders distributing over 1 million emails per month face a significantly lower average inbox rate of just 26.54%, compared to 67.52% for those sending between 200K and 1 million emails, demanding extreme diligence for enterprise brands.
- The battle against spam is a massive undertaking for inbox providers, with Gmail alone blocking over 15 billion spam emails every single day, which shows the intense scrutiny all incoming commercial mail faces before reaching the primary inbox.
- Marketers are increasingly turning to technology to overcome these hurdles, with 95% of marketers expecting Generative AI to play a role in optimizing email copy and subject lines by 2026, and early adoption of AI-driven personalization already resulting in a 13.44% increase in click-through rates.
| Average Deliverability | 81% |
| High-Volume Sender Deliverability | 26.54% for 1M+ emails/month |
| Gmail Inbox Rate Q2 2025 | 56.27% |
| AI Impact on CTR | +13.44% increase |
Conclusion
Overall, email marketing is not just a fading one; it is the most robust, reliable, and profitable channel in a digital world obsessed with social trends. These data are clear: those who invest in sophisticated, data-driven email marketing strategies, focusing on segmentation, mobile optimization, and automation, will continue to see returns that no other platform can match, and the benchmark is now set at $42 for every dollar invested. I hope you like this article. Thanks for staying up till the end.
