





Opening
Online Vs In-Store Shopping Statistics: Consumer behavior keeps changing, and in a scenario like this, online shopping becomes more competitive with in-store shopping. A good example could be taken from Walmart itself. Due to the increase in digitalization and globalization, online shopping has increased rapidly over the last ten years.
In 2026, convenience, technology, and economics will all be the strong forces behind the new trends. The online vs. In-store shopping statistics refer to the general percentage of consumers worldwide who prefer to shop in a certain way.
What Caught the Editor’s Eye
- According to online vs. in-store shopping statistics, Americans plan to make roughly 38% of their holiday purchases mostly online in 2025.
- Department stores accounted for half of Americans, with 22% patronizing bookstore retail outlets.
- Online vs. in-store shopping statistics show that preferences remain different across the world. In the U.S., online shopping preference stands at 28% in 2025.
- Shopping habits in 2025 reveal that UK consumers have become firmly omnichannel, with around 83% preferring a mix of online and in-store shopping, and over 80% shopping online at least once a month.
- As for cross-border shopping, e-commerce in the U.S. accounted for 16.7% of total retail sales in Q4 2025 (up from 16.4% in Q3 2025 and 16.0% in Q1 2025), indicating that its growing importance in e-commerce continued into 2025.
- Global growth in online shopping in 2025 continued to feature Amazon dominating the ranks of worldwide sites in retail, at 40.5% of the U.S. online retail market specifically, while globally Alibaba holds roughly 23% of global e-commerce GMV and Shein commands about 50% of the U.S. fast fashion market.
- Online vs. In-store shopping statistics reveal that more than 80% of shoppers utilize easy return procedures as a reason for preferring online shopping, while fashion items comprise 23% of online shopping in the U.S.
- For Q2 2025, U.S. e-commerce sales indicate continued strong sales for non-store retailers (accounting for roughly 59% of total e-commerce sales, or an estimated USD 180 billion), with total quarterly e-commerce sales reaching USD 304.2 billion overall.
- Meanwhile, shopping-format preferences have shifted notably: about 64% of Gen Z shoppers now prefer to shop in-store when discovering new products in 2025.
- Generation Z remains highly omnichannel: 69% begin browsing online, while 53% still browse in-store, and 29% will buy in-store an item originally spotted online, reflecting continued blended shopping behavior rather than a simple 41% prefer in-person split.
- In-store purchasing still prevails with Generation X and Baby Boomers, although online shopping has grown robustly.
Online Vs In-Store Shopping During the Holiday Season
(Reference: statista.com)
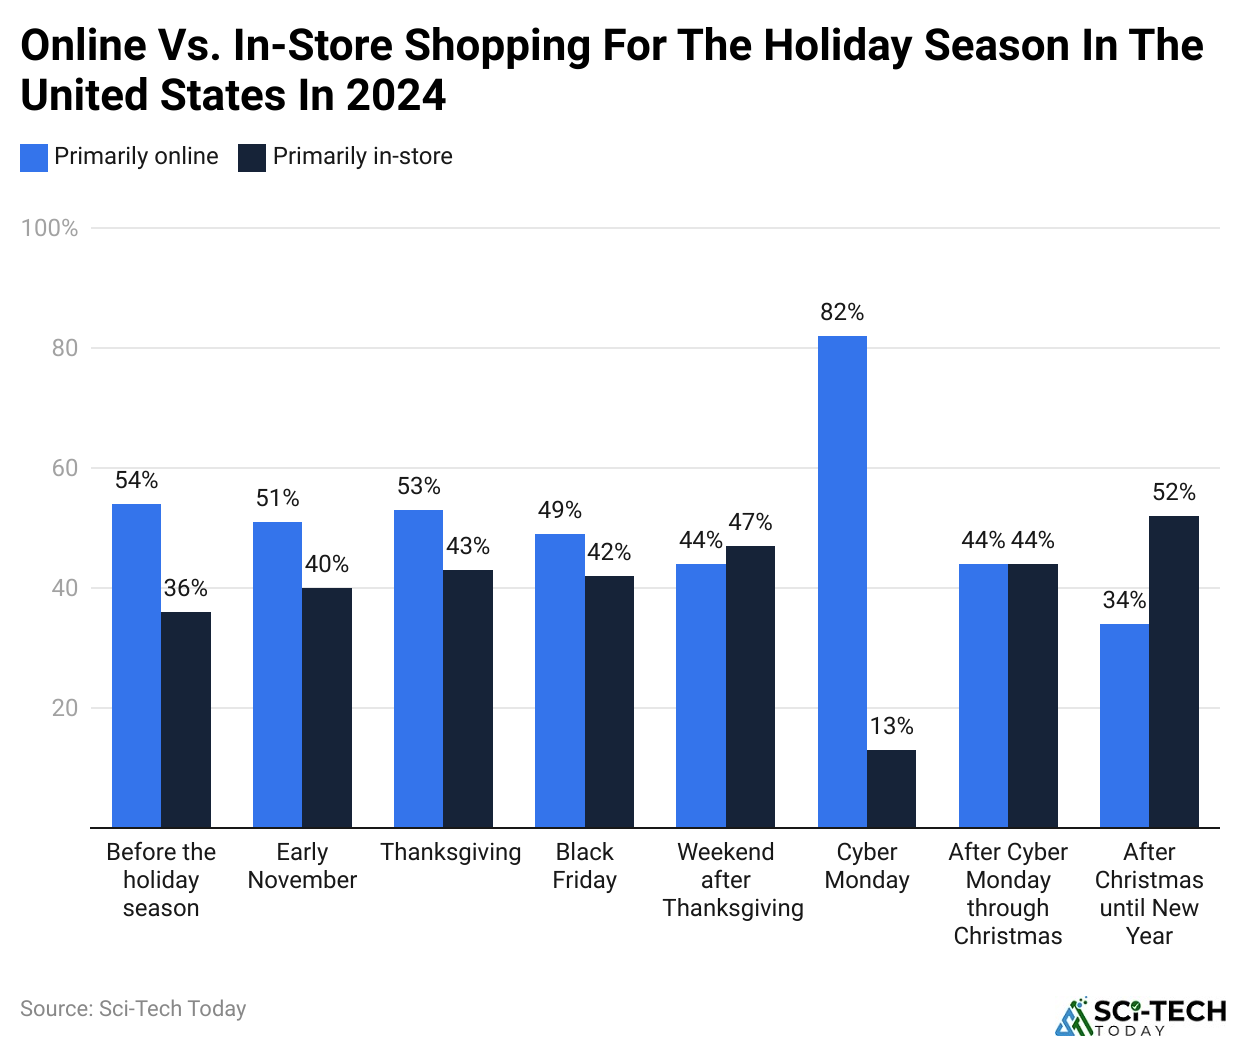
- The majority of shoppers in the U.S. turned to online shopping as their primary source for holiday purchases in 2024 as well as in 2025.
- The trend reflects the increased convenience and accessibility in the online retail sector during the peak shopping period.
- Online Vs In-Store Shopping Statistics reveal that the above trend category, on the other hand, was supposed to outperform the online sector not only for two times- the weekend after Thanksgiving- but also for Black Friday and the week after Christmas before New Year’s Day, in favor of in-store shopping.
- This was done in a period when there was high public traffic to physical stores because of doorbuster deals, last-minute shopping, and the need for immediate product availability for consumers.
- Although the trend was leading to a lot of online shopping, these instances showed that traditional shopping had its own charm during the holiday periods.
Online Vs In-Store Shopping for Purchasing Products
(Source: statista.com)
- Consumers continued to depend on both digital and physical channels to find and purchase products in 2025.
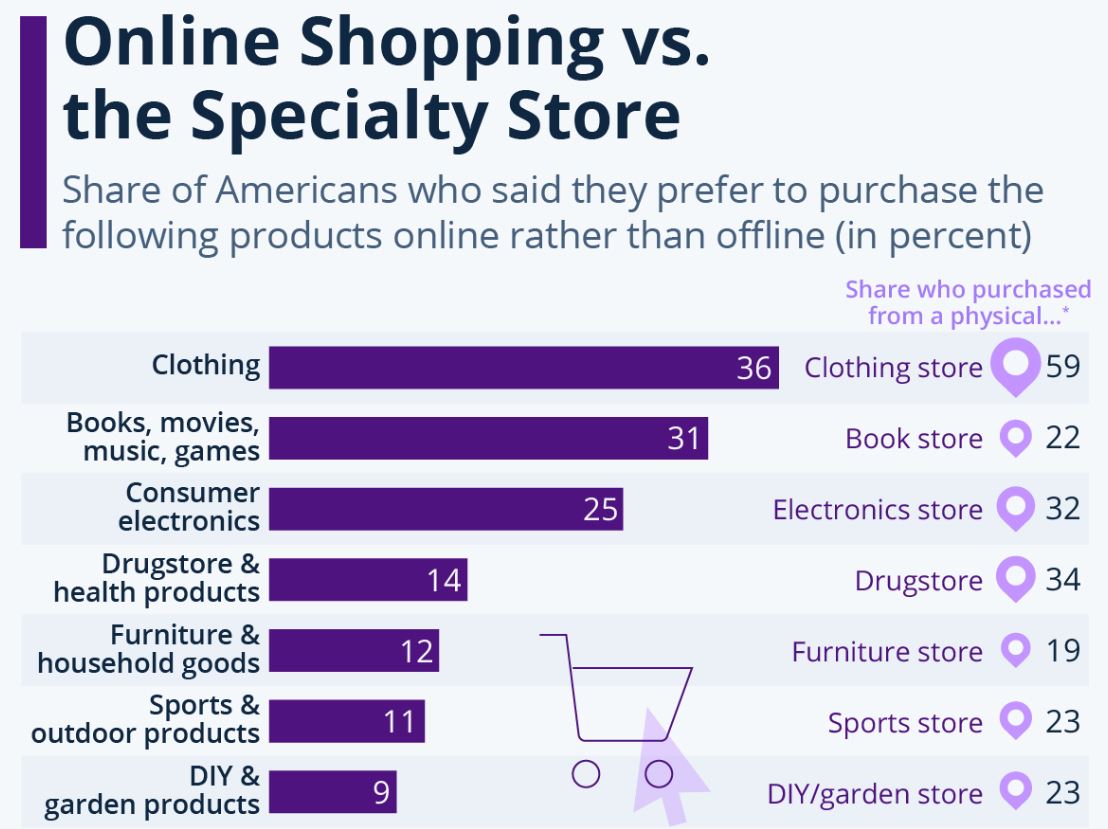
- According to online vs. in-store shopping statistics, 33% of U.S. consumers preferred to purchase apparel, shoes, and accessories online, while 43% bought clothing online during the preceding 12 months.
- Clothing stores still attracted substantial in-person demand: 51% of Americans preferred to buy clothes from a physical store, indicating a near-even split between digital and store-based apparel shopping.
- Other specialty stores face continued competition from e-commerce and department stores, as online retail accounted for 16.7% of total U.S. retail sales in Q4 2025.
- Directly comparable 2025 figures for the share of Americans who shopped at department stores (50%), bookstores (22%), or preferred online book purchasing (31%) were not found, so those exact figures cannot be reliably updated.
- Books, in particular, were more popular online, with 31% of Americans preferring a digital venue for buying them.
- Some forms, such as drugs and health products, and do-it-yourself items and products for gardening, still had significant advantages on physical shop floors.
- For example, drugstores had 20% more in-store, by their nature, habitual customers than online buyers.
- Overall, physical retail remains important: in-store purchases accounted for 77% of U.S. fast-moving consumer-goods sales in 2025, despite a 16% increase in online shopping occasions.
Online Vs In-Store Shopping Spending
(Reference: statista.com)
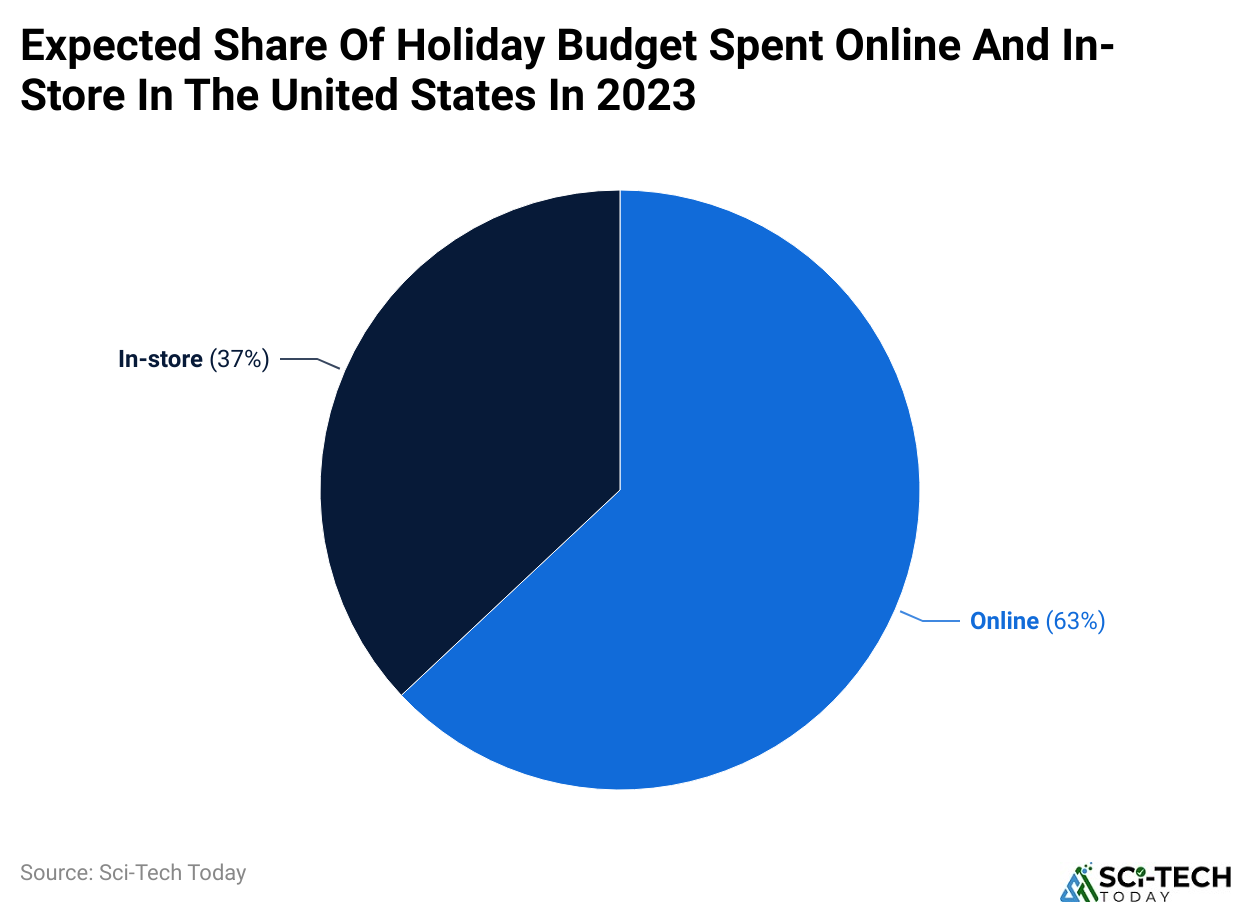
- A U.S. survey conducted in August–September 2025 found that consumers planned to spend about 60% of their total holiday budget online, with the remaining about 40% allocated to brick-and-mortar purchases.
- This indicates that digital shopping remained the preferred holiday channel, although physical stores continued to receive a substantial share of planned spending.
Share of Consumers on Online Vs In-store Shopping by Country
(Reference: statista.com)
- In 2025, consumers across markets continued to use both channels, with a slight preference for shopping in physical stores. A global survey found 53% planned to purchase in-store, compared with 51% online; 38% said they valued both channels equally.
- In the United States, online shopping occasions rose 16% in 2025, but stores still generated 77% of fast-moving consumer goods sales, showing that physical retail remained dominant for routine purchases.
- Across Europe, 78% of internet users bought online in 2025, up from 62% in 2015. This measures online purchasing participation, not preference over physical stores.
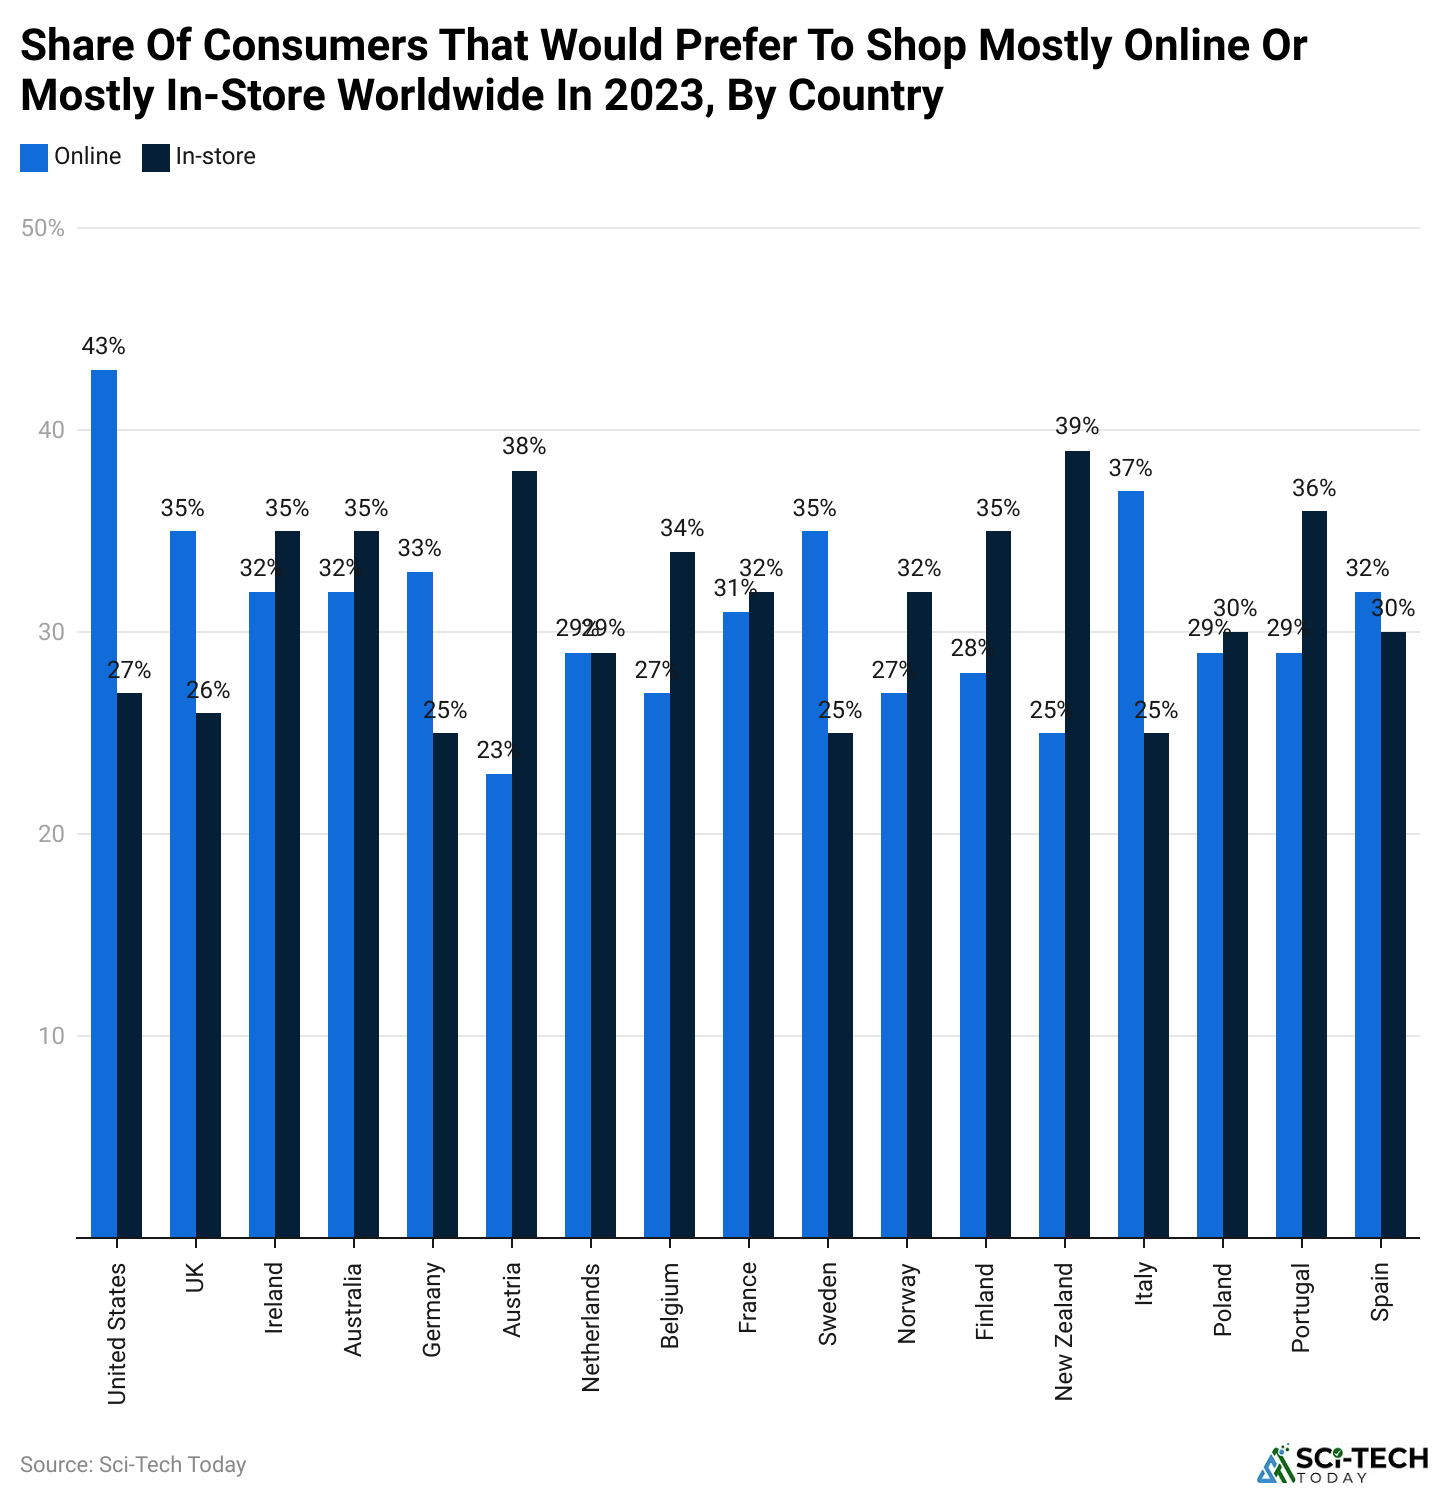
- In Ireland and Australia, consumer preferences are not particularly well balanced, and both have local online and in-store shopping figures of about 32% for online and 35% for in-store shopping.
- It is quite remarkable that the Netherlands would equalize, with around 29% of consumers opting for each of the two shopping methods.
- Other countries, such as France and Norway, are also very close to this average, as in France, 31% buy online, and 32% do so offline. In Norway, it is at 27% online versus 32% for in-store purchases.
- Germany, Sweden, and the UK show a very high share of online shopping, between 33% and 35%, yet a significant preference for in-store shopping still applies, with values between 25% and 26%.
- Poland and Portugal present a similar showdown between both modes of shopping, with equal shares of around 30% for both.
- The differences show, therefore, different consumer behavior across regions and roots relating to such factors as infrastructure, cultural habits, and access to digital services.
Weekly Consumers of Online Vs In-store Shopping
(Reference: statista.com)
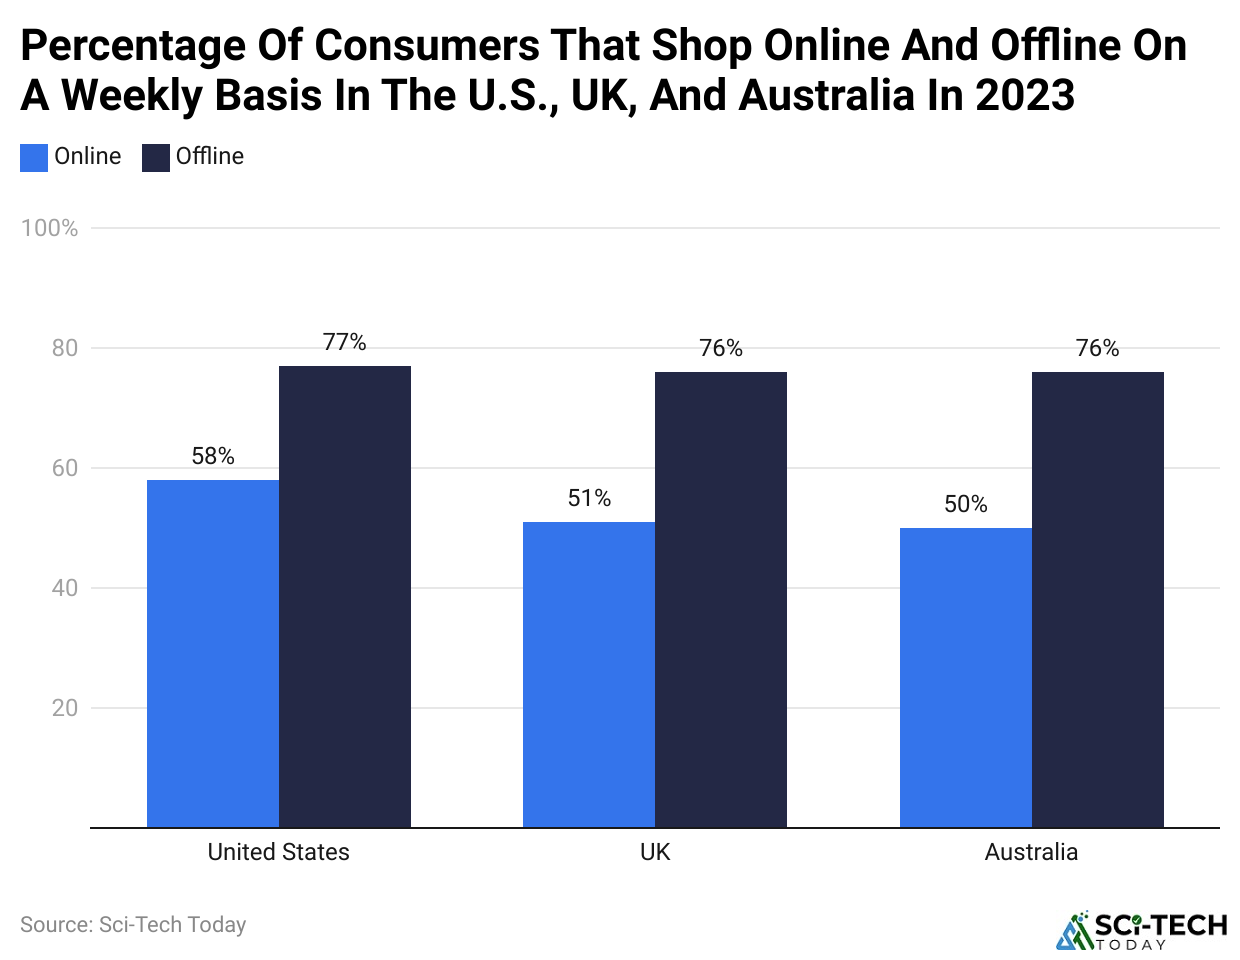
- In the UK, nearly 40% of consumers shopped online at least once per week in 2025, lower than the 50% figure cited for 2023. Online purchases accounted for about 28% of UK retail sales in September 2025.
- Physical retail remained important: 61% of UK shoppers primarily favoured in-store shopping, compared with 39% who shopped mostly online.
- In Australia, survey estimates vary by methodology: 31% of consumers said they shopped online at least weekly in one 2025 survey, while PayPal’s broader measure found 69% bought online at least weekly, averaging 2.9 online purchases per week.
Sales Of Online Retail Stores
(Source: statista.com)
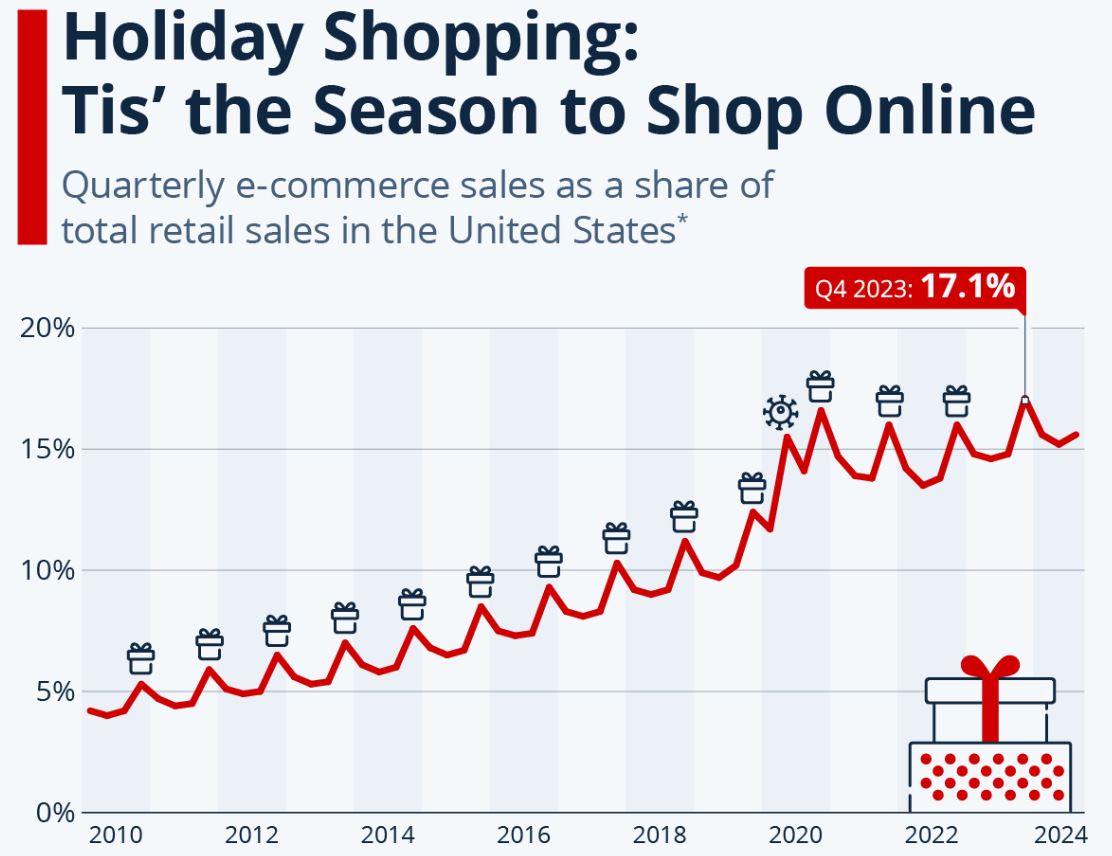
- Online vs. in-store shopping statistics show that U.S. e-commerce sales accounted for 16.7% of total retail sales in Q4 2025, up from 16.0% in Q1, 16.3% in Q2, and 16.4% in Q3. For the full year, e-commerce represented 16.4% of U.S. retail sales, compared with 16.1% in 2024.
- This confirms the continuing importance of e-commerce, which has risen from 7.1% of total retail sales in 2015 to more than 16% in 2025.
- Notably, the shift to online sales was intensified by the COVID-19 pandemic, which was recorded as the most unusual spike in Q2 2020 when most people were confined to their homes.
- Since then, the trend has largely stabilized and returned to a more gradual growth path. In 2025, the Q4 e-commerce share of 16.7% was only about 3% higher than the Q1–Q3 average of approximately 16.2%, demonstrating a much weaker holiday-driven spike than before the pandemic.
- In 2021, 2022, and 2023, for example, the percentage age of Q4 e-commerce shares was 13%, 16%, and 16% above the respective averages for Q1-Q3.
- Before the pandemic, seasonal spikes ranged from about 25 to 30%. This implies that e-commerce nowadays plays a role much more consistently throughout the year rather than just during holiday periods.
Global Online Retailers’ Cross-Border Purchase
(Reference: statista.com)
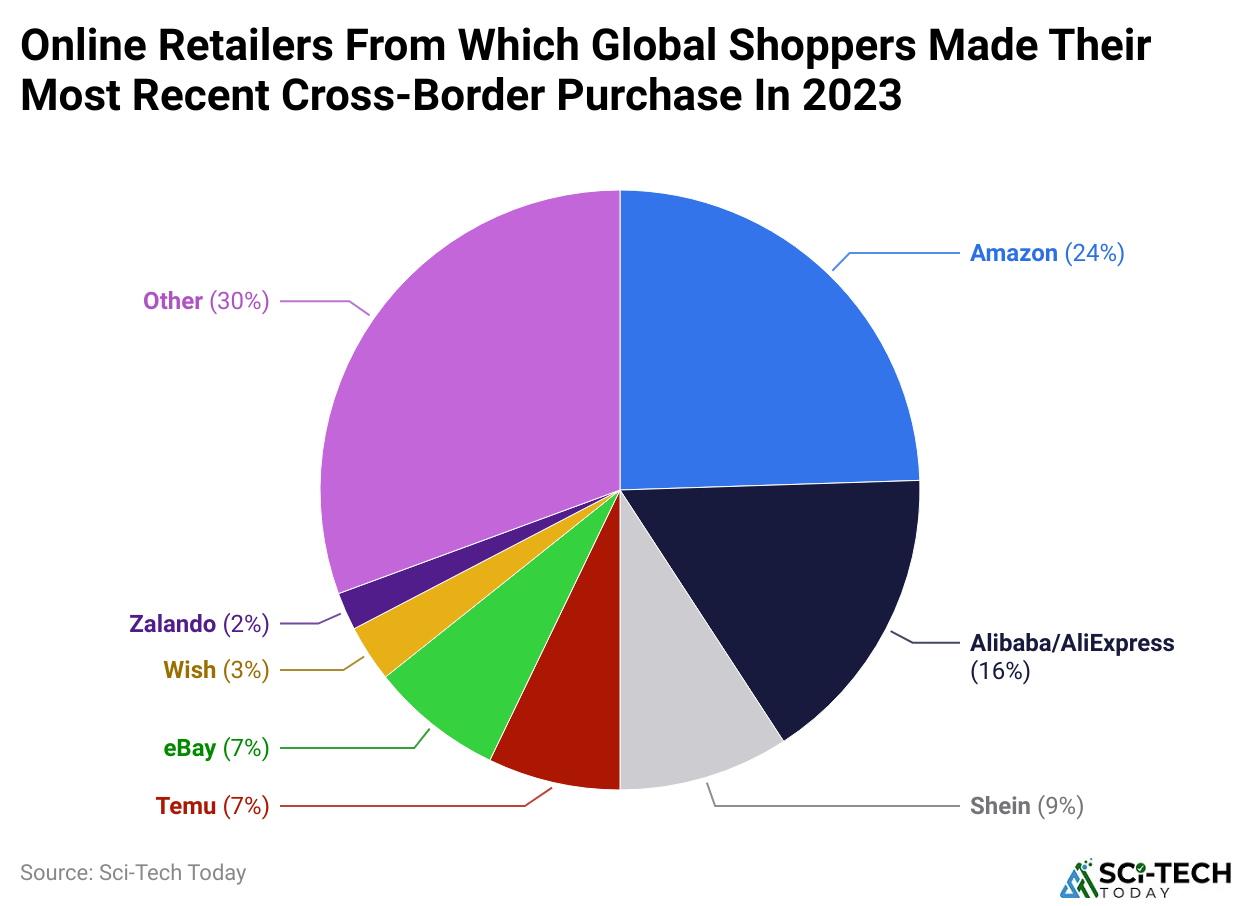
- In 2025, cross-border shoppers used a changing mix of international retail platforms for their most recent purchases.
- Amazon and Temu jointly led, each accounting for 24% of shoppers’ most recent cross-border online purchases. Temu’s share rose sharply from 7% in 2023 (and less than 1% in 2022), while Amazon retained its leading position.
- Shein retained third place at 9%, while AliExpress accounted for 8%, eBay for 5%, and Zalando for 3%.
- Moreover, the remaining online retailers account for about 30% of the international purchases, showcasing a range of platforms utilized by customers in their online shopping activities.
Online Vs In-Store Shopping by Consumer Behavior
- Consumer preferences and opinions influence online shopping more than what influences them while shopping traditionally.
- Moreover, reviews and proper product images become very important because consumers are not able to feel or touch the product.
- For example, 75% of online shoppers make decisions based on product images of the products and having images becomes very important in order to increase the chances of making a sale.
- The statistics of Online shopping vs In-store shopping show that during Yule season, 57% of Americans will be online shoppers, while 43% of them will visit physical stores.
- Convenience plays an important role in influencing shopping, as more than 80% of consumers do not visit stores because of the consistent return policy of the store.
- Also, in the US, fashion products make up about 23% of online sales, and this percentage has been steadily increasing for two decades.
Online Vs In-Store Shopping Revenue and Market Share
In Q2 2023, e-commerce sales in retail were segmented into the following product categories:
- General merchandise stores, having contributed to sales (worth USD 27 billion), accounted for 10.1% of total sales.
- Motor and vehicle parts dealers contributed 5.4%, with sales worth USD 15 billion.
- Electronics and appliances stores accounted for 4.6%, with sales of USD 13 billion.
- Non-store retailers received 61.8% of sales, amounting to USD 168 billion.
- Clothing and Clothing accessories stores accounted for 6.2, selling USD 17 billion.
- Furniture and Home Furnishings Stores held 1.6% of sales – USD 4 billion.
- Food and beverage shops drew USD 7 billion in sales, which amounted to 2.8%.
- Miscellaneous categories like gas stations comprised 1.8, or USD 5 billion.
- Healthcare and personal care stores accounted for 0.7, making USD 2 billion.
- Building materials, garden equipment, and supplies dealers made up 0.03, or 3.7% with USD 10 billion in sales.
- This was contributed by sporting goods, hobbies, musical instruments, and bookstores, which added up to 1.3 USD 4 billion.
Online Vs In-Store Shopper Statistics
- Indeed, the quintessential modern consumer may cite convenience as the ultimate reason for shopping online as well as offline, not minding the kinds of habits or preferences she or he has.
- In 2025, consumer preference still leaned toward physical stores: 28% of American consumers preferred online shopping, 45% preferred in-store shopping, and 26% expressed no preference or declined to answer.
- Among consumers who preferred to shop online, 72% cited convenience and 68% cited saving time as their primary reasons.
- Among shoppers who preferred stores, 53% said in-person shopping was more enjoyable; 49% cited convenience; and 48% said physical locations made product comparison easier.
- Among the in-store shoppers, 54% find their experience more pleasurable, and 47% say it is easier to compare items at physical locations; in addition, 47% of them cite convenience as the reason for preferring to shop in stores.
- Product-category preferences remained distinctly skewed online for some items: 37% preferred buying personal electronics online, followed by apparel, shoes, and accessories (33%), beauty and personal-care products (30%), furnishings and appliances (24%), and groceries and household goods (21%).
- 29% would like to buy beauty and personal care products via online shopping. 23% buy furnishings and appliances over the Internet, and 19% buy their groceries and household items online.
Online Vs In-Store by Generation
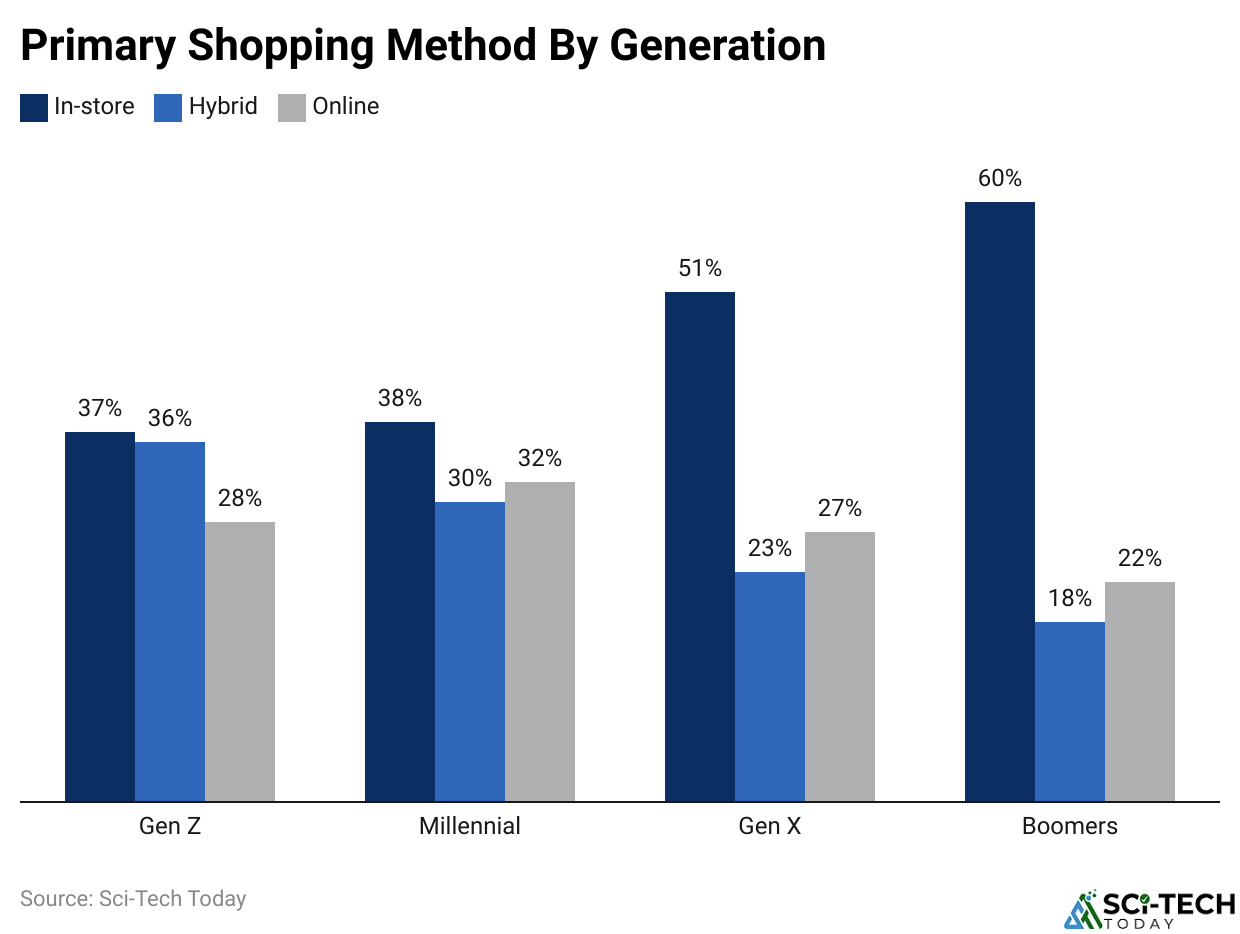
(Reference: capitaloneshopping.com)
- Older generations prefer shopping in-store. Younger generations tend to shop online more often.
- Baby Boomers were born between 1946 and 1964, and they are the group that mostly shops in physical stores—33.3% more Baby Boomers shop in-store compared to all other shoppers.
- As for online shopping, the so-called Millennials—those born from 1980 to 1994—are by far the most likely group to purchase online, with 14.3% more of them shopping primarily online than the rest of the population.
- Generation Z, born between 1995 and 2003, is the generation that is most likely to be hybrid shoppers, treating both online and in-store shopping as options.
- This shows that Gen Z has 33.3% more hybrid shoppers than all consumers.
- Online vs. in-store shopping statistics show that 36% of U.S. Gen Z consumers regularly shopped both online and in stores in 2025, making Gen Z the most hybrid-oriented generation. Given a choice, 37% preferred stores and 28% preferred online shopping.
- If given a choice between shopping in stores or shopping online, 41% of Gen Z adults prefer shopping in-store, while 34% prefer shopping online. The rest, 25%, either have no preference or declined to answer.
- Nearly 30% of Millennials tend to regularly shop both in-store and online. If given a choice, 36% would go in-store, while 38% prefer online shopping.
- The remaining 26 either had no preference or chose not to answer. In-store shopping: both Millennials and Gen X, those born between 1965 and 1979, shop online as frequently as Millennials do.
- Millennials remained the most online-oriented cohort: 30% regularly shopped via both channels, while 32% preferred online shopping and 38% preferred in-store shopping.
- Generation X continued to favor physical retail more strongly: 23% regularly shopped in both channels, while 51% preferred stores and 27% preferred online shopping.
- The remaining 26% either have no preference or declined to answer.
- Baby Boomers were the most store-oriented group: 18% regularly shopped both online and in stores; 60% preferred in-store shopping, compared with 22% who preferred buying online.
- Roughly 18% of Baby Boomers buy from both online and brick-and-mortar stores.
- If offered a choice, 47% of Baby Boomers would shop in a store, while 30% would prefer shopping online.
- The other 23% either have no preference or declined to answer.
The End
According to online versus brick-and-mortar shopping statistics, online shopping augments in-store shopping very effectively, and in 2026, it will be supplemented by convenience, personalization, and technology that is provided. Retailers who follow omnichannel approaches will be best suited to take advantage of growth in the future.
FAQ
Yes, Gen Z heavily favors online shopping and mobile commerce, using digital platforms as their primary hub for product discovery, price comparison, and purchases. However, their habits are increasingly omnichannel, meaning they frequently research items online via social media before deciding whether to buy digitally or visit a physical store.
Whether it is better to buy online or in-store depends on what you need. Online shopping offers better prices, home delivery, and a wider selection. In-store shopping lets you touch products, get items right away, and avoid shipping fees or return hassles.
Online shopping and in-store shopping offer distinct trade-offs: online shopping provides unmatched convenience and price transparency, whereas in-store shopping delivers instant gratification and physical product interaction.

Sources