








Introduction
Customer Loyalty And Churn In Banking Statistics: Customer loyalty in banking refers to customers’ continued trust, repeated use, and long-term relationships with a bank. In contrast, churn in banking occurs when customers stop using a bank and switch to another provider. Customer loyalty helps banks reduce churn rates and maintain profitability, as retaining existing customers is usually cheaper than acquiring new ones. For this reason, churn must be monitored regularly using customer data to identify those who have left, those who might leave soon, and to act on emerging early indicators.
This article also includes Information such as account transactions, mobile or internet banking use, complaint records, and survey feedback that can be used to determine churn levels, retention patterns, and customer lifetime value. All the above current information and data analyses are based on different insights.
Best In The Editor’s Eye
- According to a 2025 report published by ElectroIQ, the average churn rate for banks was 17.6%.
- Companies spent over USD 75 billion on loyalty management last year; 47% reported that the purpose of retention was to increase customer spending.
- Approximately 90% of customers interact with a brand when engagement is rewarded.
- Consumers were most willing to share data for discounts/coupons (91%), followed by loyalty points/rewards (89%) and exclusive access (83%).
- As of 2024, approximately 20% of retail banking customers either moved money to another institution or changed their primary bank/provider.
- Female customers have higher churn rates than male customers (11.4% vs. 9%), according to medium.com.
- As of 2025, inactive members left the bank far more often (13%) than active members.
- Quantzig’s churn analytics solution delivered substantial business gains by improving churn forecast accuracy by a factor of 2.
- In Financial Services, median retention was 81%, matching a median churn rate of 19%.
- According to TechnoTrenz, in 2025, the biggest loyalty factor was 24/7 mobile access, chosen by 68% of banking customers.
General Customer Loyalty and Churn in Banking Statistics
- A report by bloggingwizard.com indicates that repeat customers were 60-70% likely to convert, whereas new leads were 5–20% likely to convert.
- A 5% increase in retention increased profits by at least 25%, and retention was about seven times less costly than acquisition.
- Companies spent over USD 75 billion on loyalty management last year; 47% reported that the purpose of retention was to increase customer spending.
- The overall average retention rate across all industries was around 75.5%.
- The percentage of marketers who have used retention through emails is 89%.
- The reasons for churn were poor service (the reason was for 71%), although 44% emphasized acquisition, and 18% emphasized retention.
- According to medium.com, the scores of customer satisfaction were equally distributed, with each of the scores making up around 19-20% of customers.
- The age of churned and retained people was relatively similar, with most being between 30-50 and credit scores between 600-700.
- Balances for churned customers tended to be lower, clustering mainly between 40,000 and 125,000.
Loyalty Program and Incentive Engagement Analyses
- Digital Silk’s report showed that roughly 92% of consumers will engage with brands if rewarded.
- Meanwhile, 71% switched to another brand that offered better incentives.
(Reference: digitalsilk.com)
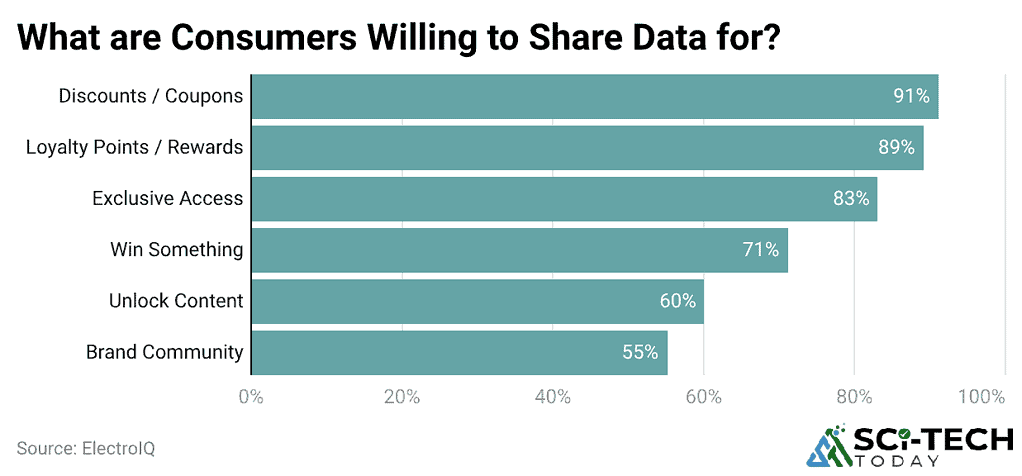
- Consumers were most willing to share data for discounts/coupons (91%), followed by loyalty points/rewards (89%) and exclusive access (83%).
- Willingness then dropped to win something (71%), unlock content (60%), and join a brand community (55%).
- Roughly 75% of all consumers are part of paid loyalty schemes, whereas nearly half of those not belonging to any such scheme said they would pay if the offer was appropriate.
- The most desired reward was cash back (64%), followed by free products & gifts (58%), free shipping & returns (55%), birthday & anniversary gifts (55%), and personalised rewards (46%).
- Almost 65% of U.S. consumers wanted to redeem rewards at any time, while the ease of earning points influenced 55% of users.
- Coupons led discounts, used by 40% of U.S. consumers.
- Finally, 30% joined loyalty programs by signing up for newsletters.
Bank Churn Statistics
- A 2025 report on ElectroIQ said banks had an average customer churn rate of 17.6%.
- In North America, retail banks experienced a larger decline of 19.2% due to weak websites and mobile app experiences.
- Digital-only banks remained lower at 10.8% because they typically offered a smoother user experience and faster support.
- People primarily changed banks due to high fees (43%), poor customer service (39%), and insufficient digital tools (32%).
- Attribution among older customers increased by 15%, whereas Gen Z customers left at a 7.5% rate due to inconsistency across apps, phones, and branches.
- Around 28% reported data breaches or security concerns.
- Reduced personalisation led to a 22% decline among small-business clients.
- If people waited more than 10 minutes for help, their likelihood of leaving the bank increased by 13%.
- In 2025, poor mobile apps also prompted 35% of users to consider switching providers.
Retail Banking Switching and Revenue Impact
- According to redpointglobal.com, in 2024, approximately 20% of retail banking customers either moved money to another institution or changed their primary bank/provider.
- A J.D. Power report stated that 13% of U.S. retail bank customers reported being likely to switch banks within the next 12 months.
- With a modest USD 2,500 customer lifetime value, losing 1,000 customers resulted in approximately USD 2.5 million in lost revenue.
Banking Retention Analyses
- The additional information provided by a Blogging Wizard survey showed that among those who were given a better offer from a competing bank, 80% said that they would consider switching.
- From those who switched, 56% said that their bank did not make any significant efforts to retain them.
- About half of the customers who switched banks did so during the first 90 days after opening an account.
Customer Churn Rate by Demographic
- Female customers have higher churn rates than male customers (11.4% vs. 9%), according to medium.com.
- By age, churn is highest among people aged 40-50 (7.9%), followed by the 30-40 group (5.4%).
- The lowest churn is observed among customers aged 30-60.
- By country, France and Germany have the same churn rate (8.1% each), which is substantially higher than Spain’s (4.1%).
By Customer Behaviour
- As of 2025, inactive members left the bank far more often (13%) than active members.
- Customers who held a credit card churned at a higher rate (14.2%) than those without a card (6.1%).
- Customers holding at least one product had a higher churn rate (14.1%) than those with none.
- By card category, Diamond cardholders recorded the highest churn (5.5%) among all card types.
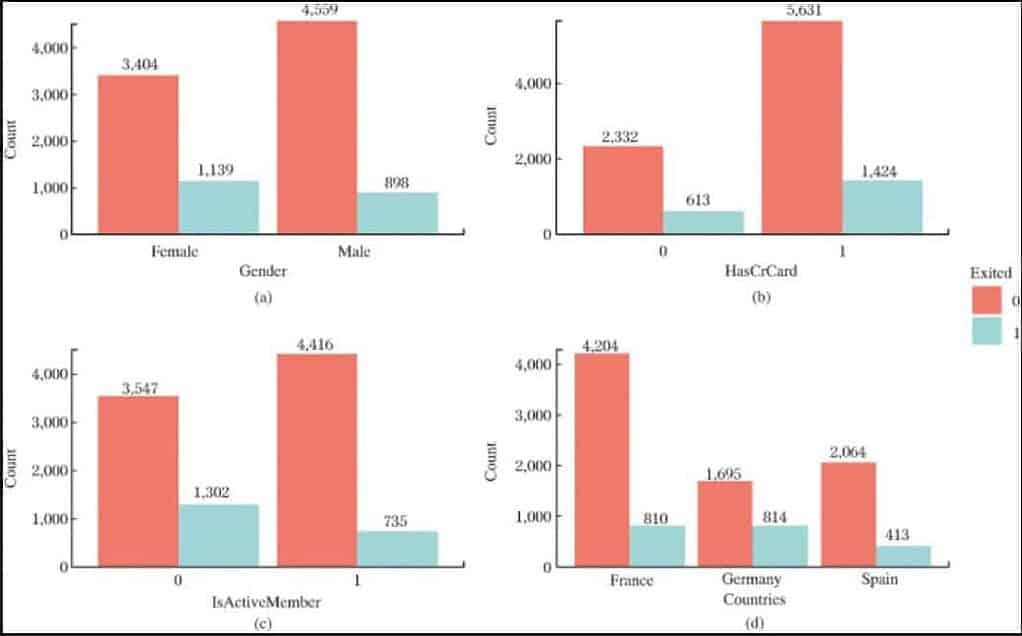
Churn Breakdown by Gender, Credit Card, Activity, And Country
(Source: ars.els-cdn.com)
| Category | Group | Total customers | Churned | Churn Rate |
| Gender | Female | 1,139 | 4543.00 | 25.1% |
| Male | 898 | 5,457 | 16.5% | |
| Credit card (HasCrCard) | 0 (No card) | 613 | 2,945 | 20.8% |
| 1 (Has card) | 1,424 | 7,055 | 20.2% | |
| Activity (IsActiveMember) | 0 (Inactive) | 1,302 | 4,849 | 26.9% |
| 1 (Active) | 735 | 5,151 | 14.3% | |
| Country | France | 810 | 5,014 | 16.2% |
| Germany | 814 | 2,509 | 32.4% | |
| Spain | 413 | 2,477 | 16.7% |
Top-Ranked Retail Banks by Region (Customer Satisfaction)
| Region | Highest-ranking bank | Score |
| California | U.S. Bank | 657 |
| Florida | Fifth Third Bank | 689 |
| Illinois | Wintrust Community Banks | 696 |
| Lower Midwest Region | BancFirst | 718 |
| Mid-Atlantic Region | Capital One | 692 |
| New England Region | Bangor Savings Bank | 726 |
| North Central Region | City National Bank | 707 |
| Northwest Region | Glacier Bank | 703 |
| New York Tri-State Region | Capital One | 673 |
| Pennsylvania | Huntington | 693 |
| South Central Region | Chase | 703 |
| Southeast Region | United Community Bank | 724 |
| Southwest Region | 1st Bank | 687 |
| Texas | Frost | 753 |
| Upper Midwest Region | Associated Bank | 669 |
Results From Quantzig’s Churn Analytics Solution
(Source: quantzig.com)
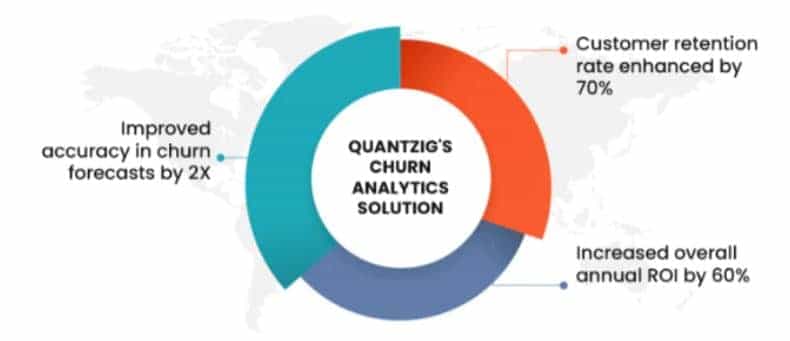
- Quantzig’s churn analytics solution delivered substantial business gains by improving churn forecast accuracy by 2 times and boosting the customer retention rate by 70%.
- It also increased the overall annual ROI by 60%, indicating a clear financial impact alongside improved predictive performance.
Average Churn Rates by Industry
| Sector | Churn Rate |
| Energy / Utilities | For energy/utility suppliers, churn far above 11% is a warning sign. |
| IT Services | IT services typically experienced relatively low churn, approximately 12%. |
| Computer Software | Software became essential during the pandemic as businesses shifted to online delivery, with churn near 14% |
| Industry Services | Industry services averaged 17% churn, possibly linked to lower B2B CX scores: about 50% vs. 65-85% for B2C |
| Financial Services | Median retention was 81%, which matched a median churn of 19%. |
| Professional Services | Professional/consulting services showed 27% churn; the consulting market was projected to reach USD 179.9 billion by 2027 |
| Telecommunications | Telecom churn averaged 31%, even as telecom providers supported the transition to remote, digital-first work. |
| Manufacturing | Manufacturing churn was around 35% during the shift to “Industry 4.0.” |
| Logistics | Logistics churn averaged 40%, with many operational “moving parts” adding pressure. |
| Consumer Packaged Goods (CPG) | CPG was reported at 40% churn here, although other sources report different levels. |
| Wholesale | Wholesale had the highest churn rate at 56%, and other findings indicated that this sector performed the worst. |
Main Reasons Customers Stay Loyal to Banks
- According to TechViral.News, in 2025, the biggest loyalty factor was 24/7 mobile access, claimed by 68% of banking customers.
- Strong data security trust was a top priority for 72% of respondents.
- Helpful, responsive support also kept customers loyal (61%), while personalised financial advice encouraged 54% to stay.
- Banks that provided a seamless onboarding experience witnessed an increase of 19% in retention.
- The inclusion of financial wellness tools for millennials helped raise retention by 17%.
- Gamification of reward programs led to a 25% improvement in retention, while AI-based fraud alerts raised the retention rate by 13%.
- Digital educational content has enhanced loyalty among 47% of Gen Z customers, and clear fee transparency has raised year-over-year loyalty metrics by 9%.
Final Thoughts
To retain customers, banks should identify churn risk early and take prompt action, as these are closely linked. People may leave due to poor service, hidden fees, weak app performance, or life changes. Loyalty persists when customers trust the bank, receive consistent support, and perceive strong value.
Banks can analyse customer data such as spending patterns, account usage, complaints, and relationship length to predict churn risk. To decrease churn rate and enhance long-term customer relationships, the bank responds quickly with fair pricing, rapid problem-solving, and simple, personalised offers.
Customer loyalty refers to customers’ trust in a bank and their continued use of its services over an extended period.
Churn is the rate at which customers stop using a bank and move to another bank or service provider.
Common reasons include poor service, unclear fee structures, slow problem-solving, weak mobile apps, and life changes.
By tracking repeat product use, account activity, customer satisfaction, referrals, and long relationship duration.
Banks calculate the percentage of customers who close accounts or discontinue service during a given period.
Less account activity, fewer logins, more complaints, reduced transactions, and sudden drops in balances.

Sources


