








Quick Verdict
Dynagas LNG Partners LP reported Q2 2026 EPS of $0.39 and voyage revenue of $41.2 million, up 6.7% year over year. Net income increased 16.8% to $16.0 million, aided by a higher Clean Energy charter rate and lower financing costs. DLNG closed at $3.86 on September 8; post-release after-hours movement was not disclosed.
About Dynagas LNG Partners LP
Dynagas LNG Partners LP (NYSE: DLNG) is a publicly traded master limited partnership that owns liquefied natural gas carriers employed under multi-year time-charter agreements. The Partnership operates a fleet of six LNG carriers with aggregate cargo capacity of about 914,000 cubic meters, generating revenue primarily from charter hire rather than spot-market LNG shipping exposure. It is headquartered in Athens, Greece, and was founded in 2013.
DLNG’s business model emphasizes contracted cash flow and long-term fleet employment. As of September 8, 2026, the Partnership had estimated time-charter coverage of 100% for 2026, 100% for 2027, and 65% for 2028, supported by approximately $730 million in contracted revenue backlog and an average remaining contract duration of 4.4 years.
Based on September 8 market data, DLNG had an estimated market capitalization of roughly $133 million–$140 million. Market-data providers reported a trailing P/E around 2.4x–2.5x and an indicated dividend yield near 5.4%, though these figures may vary with unit-price movements and future distributions.
Top Financial Highlights
- Voyage revenue reached $41.2 million in Q2 2026, rising 6.7% from $38.6 million in Q2 2025.
- Net income increased 16.8% year over year to $16.0 million, compared with $13.7 million a year earlier.
- Basic and diluted earnings per common unit were $0.39, versus $0.23 in Q2 2025.
- Adjusted net income was $15.8 million, up from $14.5 million in the prior-year quarter.
- Adjusted earnings per common unit were $0.39, compared with $0.25 in Q2 2025.
- Adjusted EBITDA was broadly steady at $27.6 million, versus $27.7 million in Q2 2025.
- Operating income rose to $19.8 million, from $19.2 million in the comparable 2025 quarter.
- Net cash generated from operating activities was $21.0 million, down 13.6% from $24.3 million, primarily due to working-capital movements.
- Cash and cash equivalents stood at $59.5 million on June 30, 2026, up from $41.0 million at December 31, 2025.
- Fleet utilization was 96.2%, below 99.4% a year earlier, reflecting 20.5 days of off-hire for unscheduled Clean Energy maintenance before its delivery to Rio Grande LNG.
- Average daily hire, gross of commissions, increased to approximately $71,810 per vessel per day, from $70,730 in Q2 2025.
- Time-charter-equivalent rate increased to $70,145 per day, compared with $67,883 per day a year earlier.
- Vessel operating expenses rose to $8.9 million, or $16,322 per vessel per day, from $7.7 million, or $14,189 per day, due mainly to crew and scheduled engine-maintenance costs.
- Net interest and finance costs declined 26.9% to $3.8 million, from $5.2 million, as debt amortization and lower market rates reduced the weighted average interest rate to 5.90% from 6.49%.
- The company paid a common-unit distribution of $0.050 per unit for Q2 2026 on August 28, 2026, and paid a Series A preferred-unit distribution of $0.5625 per unit on August 12, 2026.
Beat or Miss?
Dynagas’ earnings release did not disclose Wall Street consensus revenue, EPS, or EBITDA forecasts. Accordingly, an explicit earnings “beat” or “miss” cannot be calculated from company-provided data.
| Metric | Reported | Difference/Analysis |
| Voyage revenue | $41.2 million | Consensus estimate was not disclosed; revenue rose 6.7% year over year |
| Net income | $16.0 million | No consensus estimate disclosed; increased 16.8% year over year |
| EPS, basic and diluted | $0.39 | No analyst estimate provided; increased from $0.23 in Q2 2025 |
| Adjusted EPS | $0.39 | No comparable consensus estimate reported |
| Adjusted EBITDA | $27.6 million | Slightly below $27.7 million in Q2 2025, despite higher revenue |
| Operating cash flow | $21.0 million | Down 13.6% year over year due mainly to working-capital changes |
| Fleet utilization | 96.20% | Down from 99.4%, affected by Clean Energy maintenance-related off-hire |
The operating picture was therefore mixed but generally constructive: revenue, GAAP profit, and per-unit earnings improved, while adjusted EBITDA was nearly flat, utilization declined, and vessel operating costs increased. Lower financing costs and the commencement of a higher-rate charter for Clean Energy were important earnings supports
Cash Flow Generation and Capital Structure
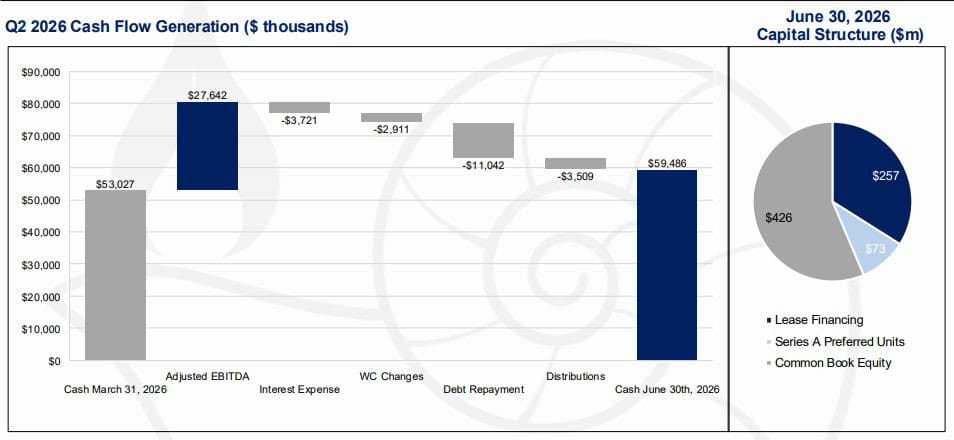
(Source: dynagaspartners.com)
- The image presents the company’s Q2 2026 cash flow generation and capital structure as of June 30, 2026.
- The company started the quarter with $53.03 million in cash as of March 31, 2026. During Q2, Adjusted EBITDA contributed $27.64 million, providing the largest positive impact on cash flow. This was partly offset by $3.72 million in interest expense, $2.91 million from working capital changes, $11.04 million in debt repayment, and $3.51 million in distributions.
- After these movements, cash increased to $59.49 million as of June 30, 2026, representing a net increase of approximately $6.46 million, or about 12.2%, during the quarter.
- The capital structure totaled approximately $756 million as of June 30, 2026. Common book equity was the largest component at $426 million, followed by lease financing of $257 million and Series A preferred units of $73 million.
- Overall, the image shows positive cash generation during Q2 2026, with strong Adjusted EBITDA more than covering interest, working capital requirements, debt repayments, and distributions, while the capital structure remained primarily supported by common equity.
What Leadership Is Saying
The release contains detailed comments from management but does not identify a separate CFO quote. The following are two distinct excerpts from the CEO’s statement, covering strategy and financial performance.
“The Partnership delivered a solid second quarter, reporting Net Income of $16.0 million, Adjusted Net Income of $15.8 million and Adjusted EBITDA of $27.6 million, on fleet utilization of 96.2%. Our results reflect the commencement in April of the Clean Energy’s new time charter with Rio Grande at an improved rate, and a lower cost of debt following continued deleveraging, with net interest and finance costs down 26.9% year on year.”
“The Partnership’s contract coverage continues to deliver predictable cash generation. As of the date of this release, our estimated contracted revenue backlog stands at $0.73 billion with an average remaining contract term of 4.4 years, and we have contracted time charter coverage of 100%, 100% and 65% of estimated Available Days for 2026, 2027 and 2028, respectively.”
Historical Performance
| Category | Q2 2026 | Q2 2025 | Change (%) |
| Voyage revenue | $41.2 million | $38.6 million | 6.70% |
| Other operating revenue | $0.6 million | $0.0 million | NM |
| Total reported operating revenue | $41.8 million | $38.6 million | 8.20% |
| Net income | $16.0 million | $13.7 million | 16.80% |
| Operating income | $19.8 million | $19.2 million | 3.40% |
| Adjusted EBITDA | $27.6 million | $27.7 million | -0.40% |
| Vessel operating expenses | $8.9 million | $7.7 million | 15.00% |
| General and administrative expenses | $0.4 million | $0.5 million | -10.90% |
| Management fees | $1.7 million | $1.7 million | 3.00% |
| Net interest and finance costs | $3.8 million | $5.2 million | -26.90% |
| Operating cash flow | $21.0 million | $24.3 million | -13.60% |
| Earnings per common unit | $0.39 | $0.23 | 69.60% |
NM = not meaningful because there was no comparable prior-year revenue. Financial figures are rounded from the company’s unaudited results.
For the first six months of 2026, voyage revenue increased 4.4% to $81.1 million, net income rose 22.4% to $33.4 million, and EPS grew to $0.82 from $0.52. However, adjusted EBITDA declined to $51.9 million from $54.8 million, while operating cash flow rose to $47.5 million from $42.4 million.
Competitor Comparison
A direct same-quarter comparison with LNG-shipping peers is not available from Dynagas’ release because it contains no competitor financial data. To avoid mixing different reporting dates, fleet compositions, accounting conventions, and charter exposures, the following table distinguishes Dynagas’ disclosed Q2 metrics from peer data availability.
| Category | DLNG Q2 2026 | DLNG Q2 2025 | Change (%) |
| Voyage revenue | $41.2 million | $38.6 million | 6.70% |
| Net income | $16.0 million | $13.7 million | 16.80% |
| Vessel operating expenses | $8.9 million | $7.7 million | 15.00% |
A valid peer earnings comparison should normalize for:
- Fleet size and vessel class, including ice-class and conventional LNG carriers.
- Contract structure, especially fixed-rate time charters versus spot-market exposure.
- Fleet utilization and dry-dock or off-hire timing.
- Debt, lease, interest-rate, and refinancing profiles.
- Regional sanctions exposure and customer concentration.
Dynagas’ six-vessel fleet and long-dated charter profile make its performance less directly comparable with larger LNG carrier owners that have a higher proportion of vessels exposed to short-term charter markets. Its major comparative strengths are contract coverage and visible backlog; its central comparative risks are fleet concentration, customer concentration, refinancing needs, and Yamal-linked sanctions uncertainty.
How the Market Reacted?
DLNG closed at $3.86 on September 8, 2026, the same date as the earnings release, implying an approximate market capitalization of $133 million based on available market data. The release itself did not report a specific intraday or after-hours stock-price reaction, so a definitive earnings-driven price move cannot be established from company disclosures.
Fundamentally, the report reads as cautiously bullish: Dynagas achieved higher revenue, net income, and EPS while building cash to $59.5 million and maintaining full 2026–2027 charter coverage. Counterbalancing factors include lower utilization, increased vessel operating expenses, flat adjusted EBITDA, and the material regulatory uncertainty tied to its Russian LNG-related Yamal charters.



