








Quick Verdict
Dave & Buster’s Q2 2026 Earnings were closely watched this quarter. Dave & Buster’s reported an adjusted loss of $0.27 per share, missing consensus expectations of $0.19 earnings per share, while revenue of $544.1 million also trailed estimates. Shares fell sharply in after-hours trading as investors weighed the earnings miss against improving sales trends and stronger cash generation.
About Dave & Buster’s Entertainment
Dave & Buster’s Entertainment, Inc. (NASDAQ: PLAY) is an owner, operator, and franchisor of entertainment-and-dining venues built around its Dave & Buster’s and Main Event brands. Founded in 1982 and headquartered in Coppell, Texas, the company combines arcade games, dining, alcoholic beverages, live sports viewing, bowling, laser tag, and other social entertainment offerings under one roof. At the end of the second quarter, it operated 250 company-owned North American venues—184 Dave & Buster’s locations and 66 Main Event locations—plus six international franchise locations.
The company’s operating model relies heavily on discretionary consumer spending, group occasions, event-driven traffic, food-and-beverage attachment, and game-room activity. With 34.83 million shares outstanding as of September 9 and shares trading around $7.41 after the earnings release, PLAY’s implied market capitalization was approximately $258 million; this is an estimate and moves with the share price. The company did not pay a dividend in fiscal 2026, and its current quarterly net loss means a meaningful trailing P/E ratio is not applicable.
Top Financial Highlights
- Total revenue declined 2.4% year over year to $544.1 million, below the prior-year quarter’s $557.4 million.
- Company-wide comparable-store sales decreased 2.9%, though this was a sequential improvement from the first quarter’s 5.4% decline.
- Entertainment revenue fell 8.8% to $332.6 million, down from $364.5 million in Q2 fiscal 2025.
- Food-and-beverage revenue increased 9.6% to $211.5 million, compared with $192.9 million a year earlier.
- Food-and-beverage comparable sales grew 7.6%, marking the fifth consecutive quarter of positive growth in that category.
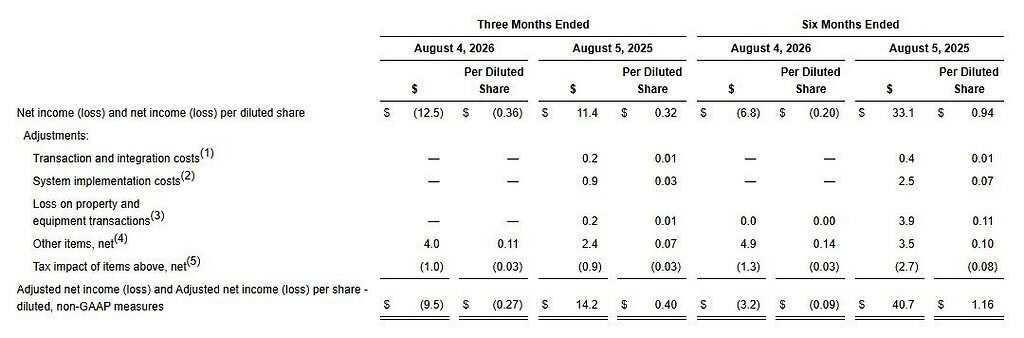
- GAAP net income swung to a $12.5 million net loss, versus $11.4 million of net income in the comparable prior-year quarter.
- GAAP diluted EPS was a loss of $0.36, compared with earnings of $0.32 per diluted share in Q2 fiscal 2025.
- Adjusted net loss totaled $9.5 million, or $0.27 per diluted share, versus adjusted net income of $14.2 million, or $0.40 per diluted share, a year earlier.
- Adjusted EBITDA declined to $98.9 million, producing an 18.2% margin, versus $129.8 million and a 23.3% margin in Q2 fiscal 2025.
- Operating income fell to $19.4 million, from $53.0 million in the prior-year period; the operating margin narrowed to 3.6% from 9.5%.
- Total operating costs rose to 96.4% of revenue, compared with 90.5% a year earlier, reflecting higher product, payroll, store operating, depreciation, and pre-opening costs.
- Operating cash flow was $46.8 million for the quarter and $160.6 million year-to-date, up from $129.8 million through the comparable six-month period.
- Adjusted free cash flow was positive $19.5 million for the first six months, an improvement from negative $36.5 million in the prior-year period.
- Cash and cash equivalents stood at $16.0 million, while available liquidity—including revolver availability—totaled $492.1 million.
- Total debt, including finance-lease liabilities used in the covenant calculation, was $1.54 billion; net debt was $1.54 billion, and the net total leverage ratio was 3.5x trailing-four-quarter Credit Adjusted EBITDA.
- Management has identified $15 million of cost savings to be realized over the coming 12 months and is targeting at least $30 million of savings as the program expands.
- The company remains on pace for less than $200 million of net capital expenditure in fiscal 2026, with management indicating fiscal 2027 net CapEx could be $150 million or lower.
Beat or Miss?
Dave & Buster’s missed both the earnings and revenue consensus benchmarks. The EPS shortfall was especially material because analysts expected a return to adjusted profitability, while the company instead reported an adjusted loss.
| Metric | Reported | Difference/Analysis |
| Adjusted EPS | –$0.27 | Consensus expected +$0.19; miss of $0.46 per share |
| Revenue | $544.1 million | Consensus expected $556.83 million; miss of $12.73 million, or about 2.3% |
| GAAP diluted EPS | –$0.36 | Versus +$0.32 in Q2 fiscal 2025; profit turned into loss |
| Comparable-store sales | –2.9% | Still negative, but improved sequentially from Q1’s –5.4% |
| Adjusted EBITDA | $98.9 million | Down from $129.8 million; EBITDA margin contracted to 18.2% from 23.3% |
| Food-and-beverage comparable sales | 7.60% | Positive for the fifth consecutive quarter and a key counterweight to weaker entertainment demand |
| Adjusted free cash flow, first half | +$19.5 million | Improved by roughly $56 million from –$36.5 million a year earlier |
The main earnings pressure came from declining comparable sales, weaker high-margin entertainment revenue, an unfavorable revenue mix, higher store-level costs, elevated depreciation, and non-normalized items. Management cited a $10 million non-cash entertainment-revenue deferral comparison, approximately $3 million of higher pre-opening expenses, and about $2 million of elevated insurance costs as notable year-over-year factors affecting adjusted EBITDA comparisons.
What Leadership Is Saying
CEO Darin Harper emphasized that the company is not changing course materially, but is sharpening execution under its “Back-to-Basics” framework—focused on capturing occasions, improving relevance, and offering clearer guest value.
“We are energized by the obvious, actionable, and enormous opportunities ahead for Dave & Buster’s and Main Event. Our Back-to-Basics strategy is gaining momentum with enhanced executional urgency.” — Darin Harper, Chief Executive Officer
“We are laser focused on returning to same-store sales and EBITDA growth, sharpening our margin management with cost saving initiatives, generating significant free cash flow, and delivering meaningful shareholder value.” — Darin Harper, Chief Executive Officer
Interim CFO Cory Hatton focused on cash conversion, cost reductions, and stricter capital allocation:
“Cash generation improved. Adjusted free cash flow was positive $19.5 million through Q2 FY26 versus negative $36.5 million through Q2 in the prior year period, a year-over-year improvement of approximately $56 million.” — Cory Hatton, Interim Chief Financial Officer
“That effort has already identified $15 million of savings, which will be realized over the next 12 months… we are targeting at least doubling the $15 million in the coming months.” — Cory Hatton, Interim Chief Financial Officer
Adjusted Net Income (Loss) and Adjusted Net Income (Loss) Per Share
(Source: daveandbusters.com)
Historical Performance
| Category | Q2 Fiscal 2026 | Q2 Fiscal 2025 | Change (%) |
| Revenue | $544.1 million | $557.4 million | –2.4% |
| Net income (loss) | $(12.5) million | $11.4 million | Shifted from profit to loss |
| Operating expenses | $524.7 million | $504.4 million | 4.00% |
| Operating income | $19.4 million | $53.0 million | –63.4% |
| Entertainment revenue | $332.6 million | $364.5 million | –8.8% |
| Food-and-beverage revenue | $211.5 million | $192.9 million | 9.60% |
| Adjusted EBITDA | $98.9 million | $129.8 million | –23.8% |
| Adjusted EBITDA margin | 18.20% | 23.30% | –510 basis points |
| Operating cash flow | $46.8 million | $34.0 million | 37.60% |
The quarter illustrates a pronounced mix shift. Food-and-beverage sales increased both in dollars and as a share of total revenue, rising to 38.9% of sales from 34.6%. However, entertainment revenue—historically the more important profitability contributor—fell by $31.9 million. At the same time, the company’s total product cost ratio rose to 15.3% from 13.7%, while payroll and other store operating costs also increased as a percentage of revenue.
Competitor Context
A direct, like-for-like public-company competitor comparison is limited: Chuck E. Cheese is privately held, while Dave & Buster’s already owns Main Event, eliminating it as an independent listed peer. The table below therefore compares PLAY’s core operating indicators with its own relevant brand portfolio and the publicly available company-wide data, rather than presenting potentially non-comparable figures from unrelated restaurant operators.
| Category | Dave & Buster’s Q2 Fiscal 2026 | Dave & Buster’s Q2 Fiscal 2025 | Change (%) |
| Company-owned venues | 250 | 237 | 5.50% |
| Store operating weeks | 3,204 | 3,066 | 4.50% |
| Revenue per operating store-week | $170,000 | $182,000 | –6.6% |
| Revenue per square foot per store-week | $4.15 | $4.43 | –6.3% |
| Comparable-store sales | –2.9% | N/A | Negative in Q2 2026 |
| Food-and-beverage comparable sales | 7.60% | N/A | Positive for five straight quarters |
| International franchise venues | 6 | N/A | At least one more planned in fiscal 2026 |
The key competitive implication is that scale expansion has not yet translated into higher unit productivity. Although the company added 13 company-operated venues year over year, revenue per store operating week declined to $170,000 from $182,000. Management’s response is to slow new-unit growth, devote more capital to games, technology, and selected remodels, and pursue traffic recovery rather than prioritizing store count.
How the Market Reacted?
PLAY shares reacted negatively after the earnings announcement. The stock closed the regular session at $8.47—up 4.05% on the day—but fell 12.53% to $7.41 in after-hours trading after investors absorbed the adjusted EPS miss and revenue shortfall. The after-hours move erased the regular-session gain and underscored that the market placed more weight on continuing losses and margin contraction than on improving monthly comparable-sales trends, positive free cash flow, and the cost-savings plan.
The report’s near-term sentiment is bearish because revenue, profitability, entertainment sales, and EBITDA all declined, while debt remains substantial. The more constructive elements are sequential comparable-sales improvement, food-and-beverage momentum, positive year-to-date adjusted free cash flow, lower planned capital spending, and a stated route to at least $30 million in cost savings. Whether those positives support a sustained rerating will depend principally on a demonstrable return to positive comparable sales and a recovery in EBITDA margins.



