





Introduction
Sales Email Statistics: Sales emails in 2026 are about getting noticed by a short list of buyers who might care rather than blasting more messages. Average cold email reply rates remain low because inbox tools also get stricter, with tighter checks for authentication and higher penalties for complaints, and privacy changes make open tracking less useful. High-performing marketers therefore track positive replies, meetings that are real, qualified chances, and pipeline growth. Teams clean their data by using signals that match the buyer, keep the message short, and follow up in a steady way. Some teams also add AI to spot sentiment in replies and guide next steps.
The statistics below show what strong performance looks like, why benchmarks do not always match, and how revenue teams can lift results without harming trust or deliverability.
Top selection
- Cold email replies: about 3.43% to 3.7% on average, while top campaigns can land around 8% to 12%.
- The average rate is about 0.3% to 1%, with 1% to 2% considered good and above 2% is elite.
- Belkins shared an average reply rate of 0.45%, which shows how testing methods can shift the numbers a lot.
- A first follow-up can bring about 40% more replies.
- About 33% of people open based on the subject alone, so subject lines need to be clear and relevant.
- The MarketingSherpa study found that adding the recipient’s first name raised open rates by 29.3%.
- Sales reps spend only about 40% of their work time, while 60% of the rest goes to admin, meetings, and research.
- Salesforce says reps using AI are about 3.7x more likely to reach quota.
- Outreach reports show 80%–90% AI reply-classification accuracy, but human review remains important for ambiguous or high-risk responses.
Sales Email Benchmarks
| Metric | 2026 planning reference | Sources |
| Average cold-email reply rate | 3.43% in Instantly’s dataset | https://instantly.ai/cold-email-benchmark-report-2026 |
| Average reply rate in Saleshandy’s dataset | 3.7% across 53 million emails. | https://www.saleshandy.com/blog/cold-email-statistics/ |
| Healthy broad-outbound reply rate | Approximately 3%–5%. | https://www.saleshandy.com/blog/cold-email-statistics/ |
| Top-decile reply rate | Approximately 8%–12%. | https://www.saleshandy.com/blog/cold-email-statistics/ |
| Average meeting-booked rate | Approximately 0.3%–1%. | https://mailshake.com/blog/cold-email-benchmarks-2026/ |
| Good meeting-booked rate | Approximately 1%–2%. | https://mailshake.com/blog/cold-email-benchmarks-2026/ |
| Elite meeting-booked rate | Above 2%. | https://mailshake.com/blog/cold-email-benchmarks-2026/ |
| Google spam-rate ceiling | Below 0.3%, with a recommended target below 0.1%. | https://www.palisade.email/learning/gmail-bulk-sender-guidelines |
- Sales covers a few different steps, which include reaching out to new contacts, replying to people who came in, messaging active deals, growing existing accounts, handling renewals, and waking up old leads again.
- The statistics mainly look at cold outreach done with permission because it is easiest to compare with public benchmarks.
- Instantly’s 2026 benchmark report puts the average reply rate for cold email at 3.43%. In that same report, the best 10% go past 10%.
- Saleshandy also shared data from 53 million cold emails sent between January and June 2026. Their average was close to 3.7%. They also said top senders tend to land between 8% and 12%.
- A healthy wide outbound target is about 3% to 5%. If a team is at 8% to 12%, showing sign of strong results, especially when the list is well chosen.
- Reply rates can shift a lot based on the buyer level, the industry, the region, the quality of the contact list, the sender’s history, and how the benchmark counts responses.
- Belkin’s latest study looked at 7.5 million emails that were strictly cold and sent during 2025 report an average reply rate of 0.45% is much lower than platform averages, which include different campaign types, customer mixes, and response definitions.
- A benchmark only helps when it uses a similar audience and a similar way of counting.
Sales Follow-Up Email Statistics 2026
- Email follow-up results depend a lot on timing, subject line, and personalization, which influence email engagement.
- Backlinko’s outreach test puts the first email reply rate at 8.5%.
- According to Stripo.email, as shared by Thunderbit, one extra follow-up lifts replies by 11%, and the first follow-up beats later ones by about 40%.
- Email outreach also tends to work faster than older outreach methods.
- HubSpot reports that email marketing brings in double the return compared with cold calling.
- The subject line matters most, as Convince and Convert found that 33% of people open an email based only on the subject.
- According to a ContactMonkey report, subjects with more than three words can drop open rates by over 60%.
- Adestra report points to “alert” and “breaking” as strong B2B terms, while readers seem to tune out words like “reports,” “forecasts,” and “intelligence.”
- MarketingSherpa report indicates that adding the person’s first name to the subject can raise open rates by 29.3%.
- The data backs a simple plan by showing keep the subject tight, personalize the first message, send one solid follow-up, and avoid many repeat pings.
B2B Sales Performance and Pipeline Benchmarks 2026
- The 2026 sales benchmarks suggest a tougher market, but the signals are easier to track.
- Instantly says cold email replies have dropped to 3.43%, compares this with about 5% in 2025 and 8.5% in 2019, while only 0.2% to 2% of cold contacts end up as closed deals.
- Woodpecker puts open rates at 15% to 25% and finds that a first follow-up can bring around 40% more replies.
- HubSpot reports meeting conversion at 2% to 3%, while Cognism says 93% of connections happen by the third outreach, with the typical path taking about three attempts.
- Close says, based on RAIN Group data, that 69% of buyers accepted a cold call from a new provider in the last year.
- GrowthList reports that 80% of sales need at least five follow-ups, whereas 44% of reps stop after one try, and only 2% of deals close on the first contact.
- LeadResponse links check-ins within 21 to 30 days to a 47% higher conversion rate for deals that take longer.
- Salesforce says reps spend 40% selling and 60% on admin and research, 84% missed quota, while 57% experienced longer sales cycles.
- AI users were 3.7 times more likely to hit quota, and the top teams used about 3 times more sales tools.
- Salesken recommends a 3:1 pipeline-to-quota ratio, while Salesgenie ties careful pipeline work to 28% higher revenue growth.
- Gartner estimates 34% conversion from MQL to SAL, and 47% conversion from SAL to SQL, while HubSpot and Outreach put average close rates at about 20%.
- Martal Group reports a 287% lift when email, phone, and LinkedIn outreach are run together, while Kinsta adds that over 80% of B2B social leads come from LinkedIn.
Sales Productivity Statistics
- In the Salesforce State of Sales, reps put about 40% of their day into direct selling, while the rest, around 60%, goes to tasks like paperwork, CRM updates, internal calls, and digging for details.
- New reps can take roughly 6 to 12 months to get fully up to speed, and even so, 84% of reps fell short of quota last year.
- Salesforce also reports top groups lean on close to 3x more sales tools than low performers do, and 81% of sales leaders think AI automation will cut down on manual steps. Reps using AI, they are about 3.7 x more likely to make quota.
- About 65% of reps report that they struggle to locate the right materials; as teams sort and store content better, they can reduce lost minutes and hours.
- With steady coaching, net sales per employee can be about 50% higher, but 84% of what people learn can be forgotten within 90 days unless they get follow-up.
- Productivity is all about guarding selling time rather than increasing activity. Teams can automate routine work, tighten lead qualification, keep content easy to find, and reinforce coaching so more hours turn into real conversations that drive revenue.
Email Open Rate Statistics and Benchmarks 2026
- Open Rate is losing reliability because personal privacy features can easily block tracking pixels without confirming that a message was read by a person.
- Sales teams should avoid using opens as the primary evidence of interest or as the sole trigger for aggressive follow-up.
| Source | Average open rate | Notes |
| Mailchimp (MPP-adjusted) | 19.21% | Open Filters machine |
| Campaign Monitor | 25-30% | Methodology of Conservation |
| Omnisend (ecommerce) | 30.70% | In 2024, it is up from 26.6% |
| Klaviyo (ecommerce) | 31% campaigns / 44.8% flows | 183K+ brands |
| Mailchimp (all opens) | 35.63% | MPP include |
| GetResponse | 39.64% | MPP include |
| ActiveCampaign | 39.26% | Transactional include |
| MailerLite | 43.46% | 3.6M campaigns, includes MPP |
(Source: geysera.com)
| Industry | Open rate range |
| Religion / Spirituality | 55-56% |
| Hobbies / Leisure | 40-53% |
| Nonprofits | 40-54% |
| Government / Politics | 38-49% |
| Education | 35-48% |
| Arts / Entertainment | 38-51% |
| Health / Fitness | 35-48% |
| Coaching / Consulting | 39-48% |
| Legal services | 47% |
| B2B services | 37-43% |
| Real estate | 31-43% |
| SaaS / Software | 36-39% |
| Ecommerce / Retail | 30-45% |
| Financial services | 34-38% |
| Publishing / Media | 32-43% |
| Restaurants / Food | 38-39% |
| Travel | 30-41% |
| Marketing / Advertising | 29-37% |
| Telecommunications | 28% |
(Source: geysera.com)
(Source: thefrankagency.com)
- As per device usage, a large share of people look at email on their phones.
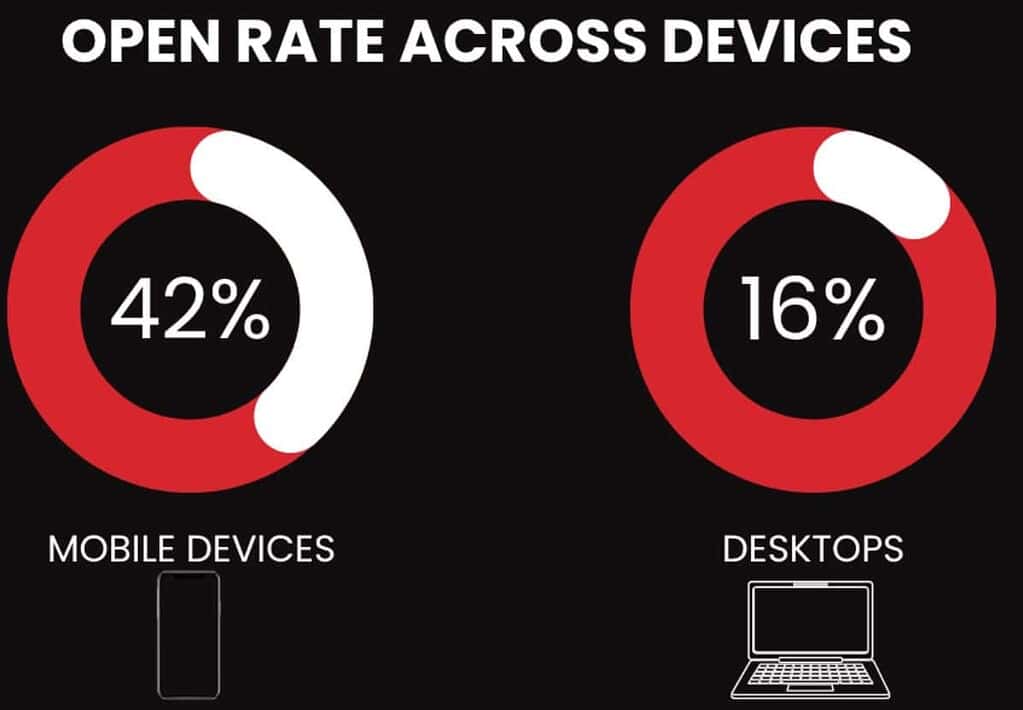
- Worldwide, 85% of online users check email via mobile, and in the U.S., the figure rises to 90%. Mobile email brings in over $1 billion in revenue, with a 41.9% open rate and a 4.29% conversion rate.
- By contrast, 68% of employees say they prefer laptops or desktops for email, while the average open rate is 16.2%.
- These numbers also mean you should judge open rates in the right setting, including the industry and the audience.
- The gap between mobile and desktop results is a strong sign that responsive design helps, and mobile-first email experiences also support better engagement and revenue.
AI and Sales Marketing
- AI sentiment analysis helps sales platforms sort replies on their own rather than reducing the need for reps to tag every message.
- Common replies can fall into buckets like positive, objection, referral, unsubscribe, out of office, wrong person, or other.
- Outreach can classify reply intent for email sequences, and reports about 80% to 90% accuracy for the main categories, which applies to languages that are officially supported.
- The level is useful for trend analysis but still requires quality assurance because ambiguous, sarcastic, multilingual, or mixed-intent replies can be mislabeled.
- AI classification also makes Positive Reply Rate easier to use at scale, and Teams can compare message versions by buying intent rather than relying only on raw engagement.
- Instantly recommend automated interest tagging right away to separate interested replies from negative ones and from out-of-office replies.
- A solid governance setup includes auditing AI labels, sending unclear responses to a human, and checking false positives in the yes and opt-out groups. If a system wrongly treats a rejection as interest, the forecasts jump; if it fails to handle an opt-out, that can lead to trouble and harm trust.
How to improve Sales Email
- Pick a small ideal-customer profile and split lists by a specific business issue, not by a wide industry name.
- Check every email address, suppress known opt-outs, and guard your sending infrastructure before increasing volume.
- Give priority to accounts that show real timing or a clear need, then connect to a reasonable claim you can defend.
- Draft a short note that explains our three things: why the recipient, why the problem, why now, and which one easy next step you want.
- Use just one clear call to action and align it to the buying path; for cold leads, ask about interest, and request a specific time to meet for active deals.
- Keep the follow-ups calm and limited because in Instantly data, 42% of replies came only after the first touch, and Saleshandy shows 44% of positive replies also arrived after the first step.
- Stop outreach right away if someone opts out, answer in a negative way, or moves into a different process that makes your sequence a bad fit.
- Test audience, trigger, problem setup, proof, CTA, send length, send timing, and gap spacing before you change every part at once.
- Use AI for research, early drafts, and reply tagging, while keeping a human in the loop when a signal looks unsure or when an account matters.
- Aim for better responses, booked calls, solid pipeline, and revenue, rather than just sends, opens, or vanity totals.
Conclusion
In 2026, people judge sales email work by outcomes but not by raw message counts. Cold-email reply averages still sit near 3% to 4%, but top runs do better, around 8% to 12% when targeting and execution are tighter. Follow-ups, sharper personalization, shorter copy, and pairing channels can help response rates, but benchmark differences show why teams should compare like-for-like datasets.
Open rate is also less reliable now, because privacy protection, positive replies, meetings, pipeline, and revenue are more useful signs. AI can speed up work and help sort responses, yet human review stays important. The best programs focus on careful outreach, clean lists, relevant signals, and clear revenue results.
FAQ
Benchmarks put the average cold-email reply rate at about 3.43% to 3.7%.
A 3% to 5% reply rate is solid, and a range of 8% to 12% is strong.
About 1% to 2% is good, and above 2% is elite.
The data cited here suggests the first follow-up can add roughly 40% more replies.
Privacy protections can inflate or distort opens, so teams should prioritize positive replies, meetings, qualified pipeline, and revenue.