









Quick Verdict
Applied Digital reported $341.9 million in revenue, up 322%, and adjusted EPS of negative $0.01, beating cited consensus forecasts. These results were part of the recent Applied Digital Corporation Q1 FY2027 Earnings announcement. GAAP continuing-operations EPS was negative $0.76. Shares initially gained approximately 3% after hours as expanding AI infrastructure supported growth, although substantial losses and debt tempered the quarter’s strong headline performance.
About Applied Digital Corporation
Applied Digital Corporation trades on Nasdaq under the ticker APLD and designs, develops, owns, and operates purpose-built data centers for artificial intelligence, machine learning, and other high-performance computing workloads. Headquartered in Dallas, Texas, the company identifies 2021 as its founding year. Its operations combine AI infrastructure leasing, energized hosting space for cryptocurrency miners, and accelerated-compute services through approximately 96%-owned ChronoScale Holdings Corporation.
An indicative equity market capitalization is approximately $7.1 billion, calculated using the October 7 closing share price of $23.81 and 297.1 million shares outstanding at August 31; this is an estimate, not a live market-cap quotation. A conventional positive earnings-based P/E ratio is not meaningful given the reported losses.
Applied Digital’s strategy centers on long-term hyperscaler leases and power-rich locations. At quarter-end, its contracted HPC portfolio covered approximately 1.41 gigawatts across five campuses, representing roughly $36 billion of revenue over initial lease terms.
Top Financial Highlights
- Total revenue: $341.9 million, up 322% from $80.9 million a year earlier.
- Consolidated net loss: $184.1 million, including discontinued operations, versus $16.9 million in the prior-year quarter.
- Common-stockholder loss from continuing operations: $221.0 million, compared with $18.5 million a year earlier. Including discontinued operations, the common-stockholder loss was $237.1 million.
- GAAP EPS: Negative $0.76 from continuing operations; negative $0.82 including discontinued operations.
- Adjusted EPS: Negative $0.01, improving from negative $0.03; adjusted net loss narrowed to $4.1 million from $7.6 million.
- Gross margin: Approximately 15.3%, calculated from $341.875 million of revenue less $289.571 million of combined revenue costs. This is consolidated gross margin, not the HPC net operating income margin.
- Operating cash flow: Positive $63.9 million, compared with an $81.5 million outflow a year earlier.
- HPC Hosting revenue: $262.6 million, comprising $65.8 million of base rent, $183.5 million of tenant fit-out services, and $13.3 million of tenant recoveries. Segment operating profit was $33.4 million.
- Data Center Hosting revenue: $37.8 million versus $37.9 million a year earlier; segment operating profit reached $13.3 million.
- ChronoScale revenue: $41.5 million, including approximately $23 million of GPU hardware sales. ChronoScale is consolidated under GAAP but excluded from Applied Digital’s presented non-GAAP measures.
- Adjusted EBITDA: $64.4 million, compared with $0.5 million a year earlier.
- HPC net operating income: $58.8 million, representing an approximately 89% margin on HPC base rental revenue—not on total company revenue.
- Cash and debt: $2.950 billion of cash and cash equivalents; approximately $3.7 billion including restricted cash; approximately $6.4 billion of debt. Restricted cash should not be treated as freely available liquidity.
- Next-quarter guidance: The earnings release did not provide numerical Q2 revenue or EPS guidance. Management instead targeted 300 MW of delivered critical IT capacity across North Dakota by calendar year-end 2026 and, on the call, more than 600 MW placed into service over the next 12 months.
- Post-quarter execution: Polaris Forge 1 reached 250 MW of ready-for-service capacity on October 1. Applied Digital also secured access to up to approximately 1 GW of potential power capacity in Finland.
Beat or Miss?
Applied Digital delivered a beat on revenue and adjusted EPS against the cited forecasts. However, revenue consensus differed across data providers, and some aggregators used adjusted revenue rather than consolidated GAAP revenue. The comparisons below keep those reporting bases separate.
| Metric | Reported | Difference/Analysis |
| Consolidated GAAP revenue | $341.9 million | Versus $124.57 million consensus cited by The Fly/Business Insider: approximately $217.3 million, or 174.5%, above expectations. |
| Consolidated GAAP revenue—alternative consensus | $341.9 million | Versus StockStory’s $135.3 million estimate: approximately $206.6 million, or 152.7%, above expectations. |
| Adjusted diluted EPS | ($0.01) | Versus -$0.30 consensus: a $0.29-per-share beat. |
| GAAP continuing-operations EPS | ($0.76) | Comparable GAAP consensus not verified; do not compare this directly with adjusted EPS forecasts. |
| Adjusted EBITDA | $64.4 million | Versus StockStory’s $39.79 million estimate: approximately $24.6 million, or 61.9%, above expectations. |
Revenue quality matters alongside the headline beat. Tenant fit-out services contributed $183.5 million—approximately 54% of consolidated revenue—while recurring HPC base rent contributed $65.8 million. Consequently, the quarter’s total revenue should not be interpreted as a recurring rental run rate.
What Leadership Is Saying
“Our goal is to establish Applied Digital as the category leader in the design, construction, deployment, and operation of purpose-built AI factories.”
— Wes Cummins, chairman and chief executive officer, earnings release.
Cummins emphasized large-scale campuses and durable contracts with investment-grade hyperscalers. On the earnings call, he shifted attention toward converting the contracted portfolio into operating capacity and sustainable growth.
“Net operating income or NOI, which is exclusive to our HPC Hosting Business, was $58.8 million, representing an 89% margin.” — Saidal Mohmand, chief financial officer, October 7 earnings-call transcript.
Adjusted Operating Margin
(Source: markets.financialcontent.com)
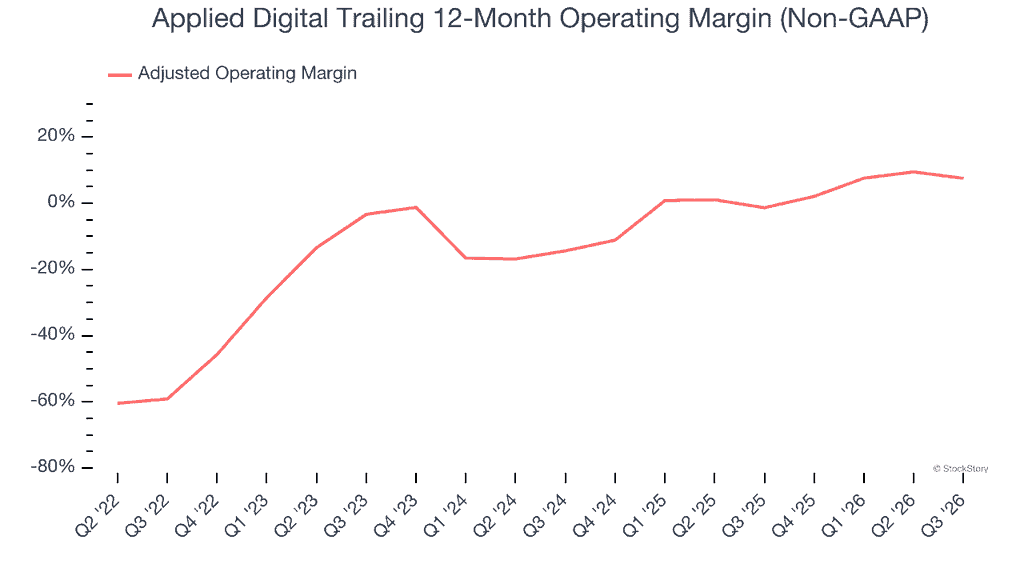
The chart shows Applied Digital’s trailing 12-month operating margin (Non-GAAP) from Q2 2022 through Q3 2026.
- The adjusted operating margin was approximately -61% in Q2 2022, indicating significant operating losses.
- The margin improved steadily through 2023, reaching around -2% by Q4 2023.
- During 2024, the margin remained negative, fluctuating between approximately -18% and -12%.
- A significant improvement occurred in 2025, with the margin reaching approximately 0% in Q1 and Q2 2025.
- The margin temporarily declined to around -2% in Q3 2025, before returning to positive territory.
- By Q2 2026, the adjusted operating margin reached approximately 9%, the highest level shown in the chart.
- It then eased slightly to approximately 7% in Q3 2026.
Revenue Growth
(Source: markets.financialcontent.com)
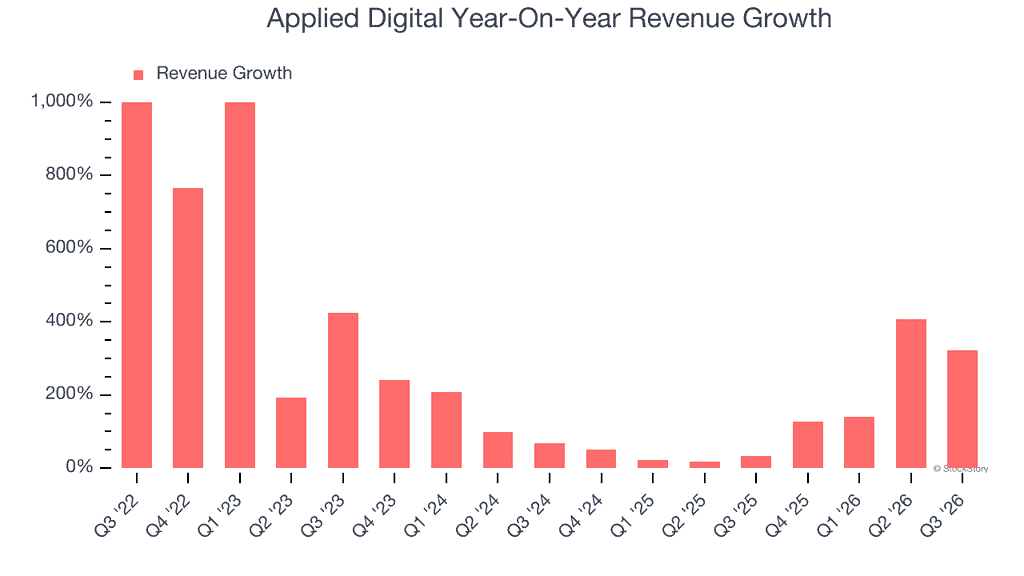
The chart shows Applied Digital’s year-on-year revenue growth from Q3 2022 through Q3 2026.
- Revenue growth was exceptionally high in Q3 2022 and Q1 2023, reaching approximately 1,000%.
- Growth remained strong in Q4 2022, at around 760%, before declining to approximately 190% in Q2 2023.
- Revenue growth increased again to approximately 420% in Q3 2023, followed by around 240% in Q4 2023.
- During 2024, growth continued to moderate, falling from approximately 205% in Q1 2024 to around 45% by Q4 2024.
- Growth reached its lowest point at approximately 10% to 15% during Q1 and Q2 2025.
- A recovery began in the second half of 2025, with growth reaching approximately 125% in Q4 2025 and 140% in Q1 2026.
- Revenue growth accelerated sharply to approximately 405% in Q2 2026, before moderating to around 320% in Q3 2026.
Overall, the chart indicates that Applied Digital experienced exceptionally rapid revenue expansion in 2022 and 2023, followed by a significant slowdown in 2024 and early 2025. Growth then recovered strongly in late 2025 and 2026, with Q2 2026 recording the strongest growth since the earlier high-growth period.
Historical Performance
Applied Digital’s comparison below uses the same fiscal quarter in each year. Dollar amounts are in millions, except EPS.
| Category | Q1 FY2027: ended Aug. 31, 2026 | Q1 FY2026: ended Aug. 31, 2025 | Change (%) |
| Revenue | $341.88 | $80.93 | 322.40% |
| Consolidated net income/(loss), including discontinued operations | ($184.06) | ($16.93) | Loss widened 987.4% |
| Common-stockholder net income/(loss), continuing operations | ($221.03) | ($18.50) | Loss widened 1,094.6% |
| SG&A expenses | $114.68 | $29.48 | 289.00% |
| Total costs and expenses, including revenue costs | $404.25 | $90.70 | 345.70% |
| Adjusted diluted EPS | ($0.01) | ($0.03) | Loss per share narrowed 66.7% |
The gap between GAAP and adjusted performance widened because the measures cover different reporting scopes and expense treatments. Adjusted results exclude ChronoScale and specified adjustments, while consolidated GAAP results include that subsidiary. Separately, interest expense increased to $77.4 million from $8.0 million as debt financing expanded.
Competitor and Industry-peer Context: CoreWeave
CoreWeave offers a relevant AI infrastructure comparison, but it is not a pure like-for-like competitor: it operates an AI cloud platform and is also Applied Digital’s tenant at Polaris Forge 1. Its latest verified quarterly release in this research covers Q2 calendar 2026, ended June 30—not Applied Digital’s August-ending fiscal quarter. The periods are therefore explicitly labeled rather than presented as identical.
| Category | CoreWeave Q2 2026: ended June 30, 2026 | CoreWeave Q2 2025: ended June 30, 2025 | Change (%) |
| Revenue | $2,575 million | $1,212 million | 112.50% |
| Net income/(loss) | -$626 million | -$290 million | Loss widened 115.9% |
| Total operating expenses, including cost of revenue | $2,624 million | $1,193 million | 120.00% |
(Source: CoreWeave’s August 11 earnings release; percentage changes calculated from reported figures)
Both companies reported rapid revenue growth alongside larger GAAP losses. Their economics differ, however: Applied Digital’s quarter included significant fit-out revenue and infrastructure rent, while CoreWeave’s results reflect its AI cloud platform. Their revenue growth and margins should therefore be compared with those business-model differences in mind.
How the Market Reacted?
Applied Digital shares initially rose approximately 3% after the earnings announcement, according to contemporaneous coverage. That followed a 6.04% regular-session decline to $23.81 on October 7. A subsequently displayed extended-trading quote showed $24.94, approximately 4.77% higher, at 4:46 a.m.
Eastern; this is distinct from the immediate after-hours reaction. The response was positive despite the sizable GAAP loss, with the revenue and adjusted-EPS beats providing a favorable counterweight to the company’s debt-heavy expansion.

Sources


