






Introduction
Sales Win Rate Statistics: One of the top indicators of sales success today is win rate. It shows how effective a firm is at converting sales opportunities that have passed through the qualification process into official sales figures. The overall win rate gives an impression of the organization’s efficiency but can really tell the health of the pipeline once the win rate is evaluated in detail.
Based on different data, the average win rate in B2B companies is around 1 to 5 opportunities won. The win rates vary among different opportunities: for new business opportunities, the win rate is in the range of 18–21%, while for expansion opportunities, it can be found to be higher.
This article on Sales win rate statistics will discuss trending statistics, including calculation, industry win rate, and channel win rate.
Top Featured
- Win rates in B2B companies average around 18–21% of opportunities, thus making one in five a relevant standard.
- While in SMB deals below US$25k of ACV, the win rate can be as high as 25–35%, for strategic deals above US$500k it falls to 8–15%.
- When selling to existing clients, the rate of closed deals is 37% compared to 19% when cold contacting, as per Champify’s Impact Report of 2025.
- Warm relationship-oriented selling achieves win rates of 30% to 40%, while cold outbound enterprise selling has a win rate of between 10% and 18%.
- SaaS and Technology achieve a win rate of 22% while having a 67-day sales cycle; Professional Services, on the other hand, has a win rate of 28% and a sales cycle of 51 days.
- Real Estate and Construction has a win rate of 16% with a sales cycle of 147 days, having experienced the impact of long buying processes.
- Leads generated through the web have about a 31.3% MQL-to-SQL conversion rate, while that for email campaigns is 0.9%.
- Deals achieved in under 50 days have a win rate of 47%, while those closed in over 50 days have a win rate of about 20% or even less.
- According to findings from Ebsta × Pavilion, those involved in RevOps have win rates that are up to 87% higher.
- Despite the fact that 82% of companies have sales plays, just 21% of them have managed to maximize their benefits.
What Is Sales Win Rate?
- Sales win rate tells how many opportunities end with a deal that is marked as closed won during a set time.

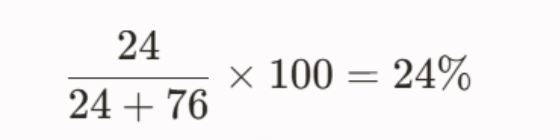
- For instance, say a team completes a quarter with 24 wins and 76 losses. The win rate for that quarter is 24 out of 100, or 24%.
- This metric helps only when the company uses the same rules each time. If one firm treats any early lead as an opportunity, its win rate will look worse than a firm that starts counting only after a proper discovery step.
- One figure is not automatically better than the other depends on how they qualify opportunities.
Win Rate Benchmarks by B2B SaaS Segment
(Source: salesmotion.io)
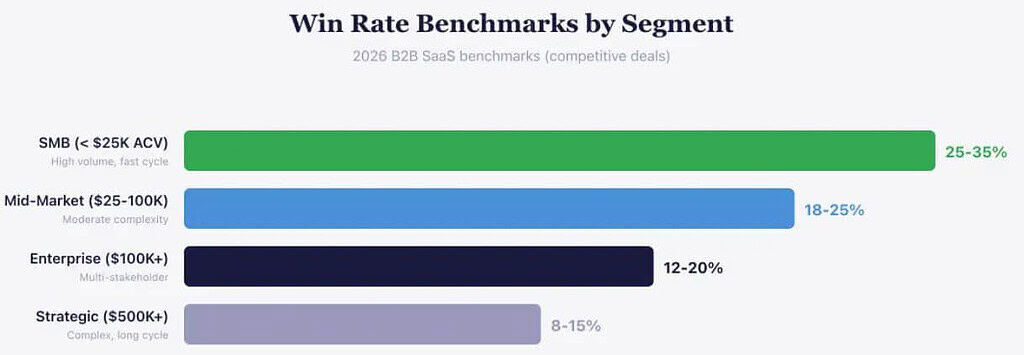
- The Optifai benchmark study lays out how B2B SaaS deals perform in 2026. It looks at win rates and connects them to deal size, how hard sales get, and how deals stack up versus rivals.
- For small business deals below US$25K ACV, win rates land around 25% to 35%. The report frames this as a high-volume motion with short turnarounds, which helps keep the spread narrow.
- For mid-market deals, from US$25K up to US$100K ACV, the win rate drops to about 18% to 25%.
- More steps are involved here, so the buying journey is not as straightforward, but the results stay in a middle band.
- Enterprise deals at US$100K ACV or more land near 12% to 20%, and the study says this is due to more people weighing in. Getting everyone aligned takes longer, and that slows decisions.
- Strategic deals above US$500K show the lowest benchmarks, and their win rate is roughly 8% to 15%.
- The report ties this to deal structures that are harder to map and sales cycles that run longer, which adds that this can bring extra competition, more procurement effort, and delays that can derail progress.
- The Prop-l.ai 2026 SaaS benchmarking also flags the need to review win rates per segment, while Artisan Strategies further notes that ACV and the length of the sales cycle both matter.
- The chart therefore suggests that as contract value climbs, deal complexity grows, which pulls down win rate, not only whether sales execution is strong or weak.
How to Calculate Sales Win Rate
- Win rate tells you how well a team turns leads into signed work, while the calculation has to fit the question you are trying to answer.
- SMB wins often sit near 25% to 35%, while strategic deals may be closer to 8% to 15%. As deals get harder, the win rate usually drops.
- The most common method is Deals Won ÷ (Deals Won + Deals Lost) × 100.
- For instance, if you have 20 wins and 60 losses, the result is 25%. This method looks only at deals that made it to an outcome.
- It is also aligned with how Salesforce frames win rate, based on qualified opportunities that end as closed-won.
- You can divide Deals Won by Total Opportunities Created. If there are 20 wins out of 150 total opportunities, the win rate is 13.3%. This version gives a broader look at pipeline flow.
- Salesforce similarly defines win rate around qualified opportunities that become closed-won business.
- For businesses with widely different deal values, the revenue-weighted win rate can be more informative.
- Winning 300K out of 650K in closed-deal value gives a 46.1% revenue win rate. That figure reflects the money impact of the bigger deals, not just the count of transactions.
- Some teams also use a win-loss ratio instead of a percentage. A ratio of 1.5 to 1 means wins come out ahead, while values under 1.0 mean the opposite.
- Meanwhile, there is also a period-based method that divides won deals by total closed deals in a set time window, which makes month-to-month or quarter-to-quarter checks simpler.
- Salesmotion presents these methods as separate ways to read sales results.
- The key analytical question is “no decision.” The inclusion of stalled opportunities increases conservatism, while the exclusion thereof focuses only on competitive activity.
- Data cited in The JOLT Effect by Matthew Dixon and Ted McKenna claims no-decision outcomes account for 40%–60% of qualified B2B pipeline, making them too vital to overlook.
- In order to have proper benchmarking, teams should select one particular method of calculation, apply it correctly, and not change the formula between quarters.
Win Rate by Sales Motion
| Motion | Win Rate Range |
|---|---|
| Warm/relationship-led | 30-40% |
| Inbound enterprise POC | 20-25% |
| Cold outbound enterprise | 10-18% |
| Selling to known contacts | 37% |
(Source: salesmotion.io)
- Sales win rates change based on how the deal is sourced and how well the seller knows the buyer.
- When selling through warm, relationship-led efforts, the win rate sits around 30% to 40%. That is the top band.
- For inbound enterprise proof of concept deals, the rate is about 20% to 25%, while Cold outbound enterprise selling is much lower, roughly 10% to 18%. The gap points to the work needed to earn trust right after the first touch.
- The benchmark is selling to known contacts, at 37%, and these are known contacts like past customers and earlier champions who later moved to other firms. I
- In the 2025 Impact Report from Champify, known contacts are linked to a 37% win rate, while Cold outreach is tied to 19% instead, which is close to a twofold lift, and it supports the idea that prior ties matter.
- The above numbers explain why teams should not use one win-rate goal for every sales motion.
- Cold enterprise outreach at 10% to 18% shows how hard it is to get traction without a connection. Warm selling at 30% to 40% lines up with the advantage of buyer familiarity and trust.
- Compare win rates by motion and by relationship strength. When you track those splits, leaders can tell what is driving results.
- It helps sort whether performance comes from the channel, from how well the buyer is already known, or from the strength of the relationship.
Sales Win Rate Statistics by Industry
| Industry | Typical Win Rate | Avg Sales Cycle |
|---|---|---|
| SaaS and Technology | ~22% | 67 days |
| Financial Services | ~18% | 89 days |
| Professional Services | 25-30% | Shorter |
| Real Estate/Construction | ~16% | 147 days |
(Source: salesmotion.io)
- The variability of win rates depending on industries indicates that the complexities of buying vary from market to market, as do their sales cycles.
- Notably, the win rate in the SaaS and Technology industry stands at about 22%, while the sales cycle lasts for an average of 67 days, signifying a reasonable combination of conversion and deal duration.
- According to First Page Sage, the win rate of 22% and the sales cycle duration of 67 days correspond to the trends related to the B2B industry.
- Conversely, Financial Services shows results significantly lower than the previous example, with the win rate being about 18% and the sales cycle lasting 89 days.
- Accordingly, it is obvious that purchases of a financial nature are much more time-consuming and require thorough analysis of the options available.
- First Page, Sage, and Ebsta highlight that the win rate in the sphere of financial services is around 18%.
- On the contrary, the professional services sphere demonstrates better results, with the win rate amounting to 25-30% and the sales cycle being noticeably shorter.
- According to First Page Sage, the win rate in the sphere is about 28%, while the sales cycle lasts 51 days.
- At the other end, Real Estate and Construction shows a 16% win rate with a 147-day sales cycle. The extended timeline creates more room for delays and stalled decisions.
- The above figures show why win rates should be benchmarked within industry rather than against a single universal target.
Win Rate vs. Close Rate: What’s the Difference?
| Comparison point | Close rate | Win rate |
| Core definition | The percentage of initial leads or contacts that become customers. | The percentage of qualified opportunities that become closed-won deals. |
| Standard formula |  |  |
| Primary owner | Marketing, SDR, sales, and revenue operations collectively. | Sales representatives, managers, solution specialists, and supporting deal teams. |
| Main diagnostic use | Evaluates targeting, lead quality, nurturing, routing, qualification, and total funnel efficiency. | Evaluates discovery, competitive execution, stakeholder alignment, value selling, negotiation, and deal control. |
| Example | 25 customers from 1,000 leads produce a 2.5% close rate. | 25 wins from 100 qualified opportunities produce a 25% win rate. |
| Best segmentation | Lead source, campaign, ICP fit, channel, region, and conversion action. | Deal size, product, competitor, segment, representative, and sales motion. |
| Key improvement levers | Better targeting, scoring, nurture, response times, routing, and qualification. | Better discovery, ROI justification, stakeholder mapping, consensus building, and deal management. |
| Principal reporting risk | Including irrelevant, duplicate, or unverified contacts in the denominator. | Applying inconsistent opportunity criteria or excluding no-decision outcomes. |
| Recommended reporting method | Lead-creation cohorts followed through to customer conversion. | Qualified-opportunity cohorts plus a separate closed-opportunity view. |
Sales Win Rate Channel and Lead Source
- Sales channel data reveals that where a lead comes from greatly affects how likely that lead is to convert.
- As highlighted by The Digital Bloom, leads from website activity convert at a rate of 31.3% MQL-to-SQL, making them more than twice as effective as leads overall.
- Customer and employee referrals follow with a conversion rate of 24.7%, while webinar leads convert at 17.8%.
- On the other hand, leads from events convert at only 4.2%, leads from lists convert at 2.5%, and email leads result in a mere 0.9% MQL-to-SQL conversion.
- Champify’s 2025 Impact Report, referenced in Salesmotion, says that selling to a known contact, such as a former customer or a champion who has moved to another company, has a 37% win rate compared to only 19% when cold calling.
- Ebsta’s 2024 B2B Sales Benchmark Report, referenced in The Digital Bloom, claims that partner-sourced leads have the highest win rates across all GTM motions.
- Partners contributed 26-28% of revenue in 2025 compared to 18-20% in 2024.
- The way to improve win rates starts with creating a better mix of different sales channels rather than only improving closing tactics.
How to Improve Sales Win Rate
To enhance win rates and succeed in sales, it is necessary for organizations to do more than monitor the metric; teams must monitor pipeline statistics and take actions accordingly.
The methodology involves automating tasks, capturing deals at the right time, ensuring consistency in nurturing, aligning with buyers, understanding buyers, and addressing different issues in decision-making.
- Automate monotonous processes: Powerful systems can cut down on tedious manual labor and enable account managers to engage in prospecting, managing pipeline coverage, and closing deals.
- Shorten the sales cycle: Various studies show that acquisitions made in less than 50 days yield a 47% win rate compared to 20% or lower. However, research reveals that 86% of purchases stall.
- Corporate Visions points out that the major problem areas when sales fail are discovery, differentiation, executive alignment, and issue resolution. According to the data collected by Ebsta x Pavilion, companies that focus on RevOps have a 21% shorter sales cycle and an 87% higher win rate.
- Respond quickly and nurture the leads right away: It is known that it takes 5 minutes or more after engagement to lose over 80% of the potential leads. Relevant content that reaches the customers quickly improves their readiness for sales conversations.
- Sync sales with the customer’s buying journey: Digital-enabled and self-driven transactions, as well as the required equipment, help ease the customer experience.
- Learn how to push or slow down the process: 77% of consumers consider their latest purchase complicated or hard, and there are 6-10 people in the buying committee.
- Repair repeating failures in decision-making: Identify common characteristics of unsuccessful transactions or undecided deals, and monitor leading and lagging indicators.
- According to Bain & Company, 82% of companies apply sales plays, but only 21% manage to get benefits from the process.
Conclusion
Sales win rate gets maximum benefits if the analysis of factors like opportunity quality, sales motion, deal size, industry, and lead source is done instead of seeing it as one universal yardstick. There is a noticeable performance difference, where deals smaller than US$100K can achieve win rates of 25%-35%, while large strategic deals exceeding US$500K can see win rates of less than 15%.
The quality of connection is also important, as leads coming from known contacts can achieve a win rate of 37%, while leads originating from cold outreach yield only a 19% success rate. Moreover, the duration of deal closing can also be a key differentiator, as deals that are closed in under 50 days can have win rates of 47%, while the win rates can drop to 20% or less afterwards.
FAQ
The typical B2B opportunity win rate is about 18% to 21%. It can shift based on the segment and the sales motion.
SMB deals under $25K ACV show the strongest benchmark range at 25% to 35%.
Yes. Known contacts come in at about a 37% win rate, while cold outreach comes in at about 19%.
Deals closed within 50 days reach about 47%, and Deals that run longer than 50 days are at 20% or less.
Website-generated leads are the top source at 31.3% conversion.