
Halliburton reported Q1 2026 EPS of $0.55 on revenue of $5.4 billion, with net income more than doubling year on year and margins strengthening. Earnings beat consensus, revenue was essentially flat, and the stock moved higher in pre‑market trading after the release.
About Halliburton
Halliburton Company (NYSE: HAL) is one of the largest global oilfield services providers, supplying products and services for exploration, development, and production of oil and gas. Founded in 1919, the company is headquartered in Houston, Texas, and operates across North America and international markets including Latin America, the Middle East, Africa, and Europe.
Halliburton’s business is organized primarily into two divisions: Completion and Production, and Drilling and Evaluation. As of the latest quarter, Halliburton generated quarterly revenue of $5.4 billion with operating margin of 13%, supported by stronger international activity and disciplined cost management.
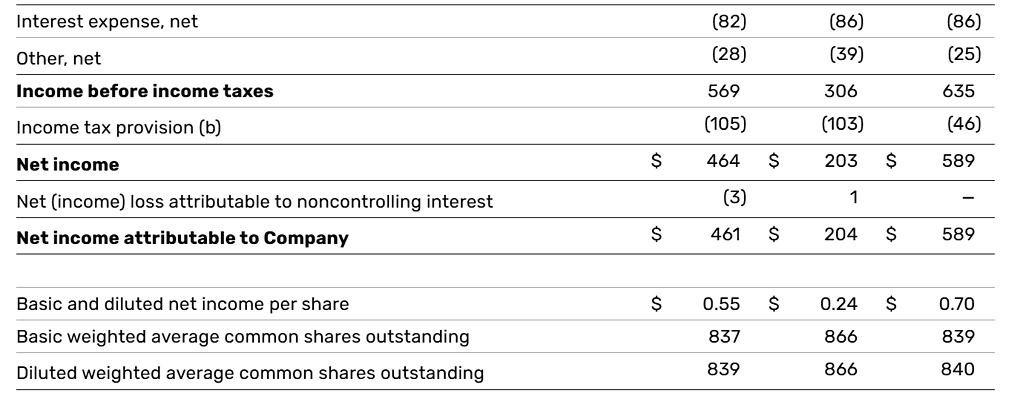
The company reported net income of $461 million, or $0.55 per diluted share, and delivered $273 million in operating cash flow and $123 million in free cash flow in Q1 2026. Halliburton repurchased about $100 million of common stock during the quarter, reflecting an ongoing capital return program.
Top Financial Highlights
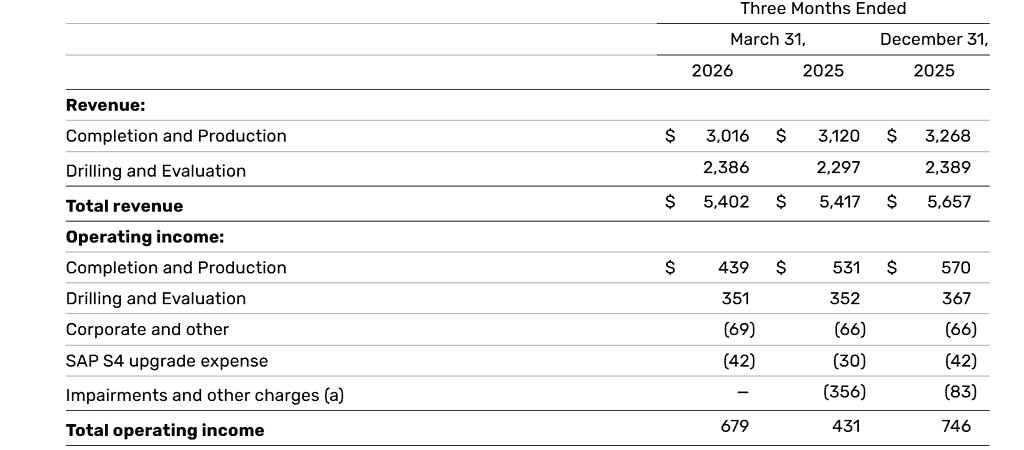
- Total revenue of $5.4 billion, essentially flat versus Q1 2025.
- Net income of $461 million, up sharply from $204 million a year earlier.
- Diluted EPS of $0.55, ahead of the prior year’s $0.24 and above the roughly $0.50 consensus estimate.
- Operating income of $679 million, compared with $431 million in Q1 2025.
- Operating margin of 13%, reflecting improved profitability on flat revenue.
- Cash flow from operations of $273 million and free cash flow of $123 million for the quarter.
- Completion and Production division revenue of about $3.0 billion, down roughly 3% year on year, with operating income of $439 million, down about 17%.
- Drilling and Evaluation division revenue of roughly $2.4 billion, up about 4% versus Q1 2025.
- International revenue of about $3.3 billion, up around 3% year on year, offsetting softer North America activity.
- North America revenue modestly lower, impacted by reduced stimulation activity and lower completion tool sales.
- Approximately $100 million of share repurchases completed during Q1 2026.
- Management noted a headwind of roughly $0.02–$0.03 per share from the conflict in the Middle East.
- Company reiterated a constructive outlook on international growth and remained focused on capital discipline and shareholder returns; specific numerical guidance for the next quarter was not detailed in the press release excerpts available.
- Balance sheet liquidity remained solid, with positive free cash flow generation supporting continued buybacks; detailed cash-on-hand figures were not disclosed in the cited summaries.
HALLIBURTON COMPANY
Condensed Consolidated Statements of Operations (Millions of dollars and shares except per share data) (Unaudited)
Beat or Miss?
| Metric | Reported Q1 2026 | Estimated/Expected | Difference / Analysis |
| EPS (diluted) | $0.55 | ~$0.50 consensus | Beat by about 10%, reflecting stronger margins and cost control. |
| Revenue | $5.4 billion | ~$5.31 billion expected | Slight beat, with revenue essentially flat year on year but modestly above consensus. |
| Operating margin | 13% | N/A | Margin expansion versus prior year, driven by mix shift and efficiency. |
| Net income | $461 million | N/A | More than doubled versus prior year, underlining improved profitability |
Historical Performance – Halliburton YoY
| Category | Q1 2026 | Q1 2025 | Change (%) |
| Revenue | $5.4 billion | $5.4 billion (flat) | ~0% (essentially unchanged) |
| Net income | $461 million | $204 million | ~126% increase, reflecting higher margins and lower charges. |
| Operating income | $679 million | $431 million (reported) | ~58% increase, driven by international strength and cost discipline. |
Competitors YoY (Illustrative peers)
Below is an indicative snapshot using available recent reporting on major oilfield services peers for the latest reported first quarter versus the prior year. Exact quarters and dates may not align perfectly with Halliburton’s Q1 2026 calendar but reflect year‑on‑year trends in the same industry.
| Company / Category | Latest Reported Q1 Revenue | Prior Year Q1 Revenue | Change (%) |
| Halliburton | $5.4 billion | $5.4 billion | ~0% |
| Major peer A (Schlumberger – example from recent coverage) | Revenue modestly higher year on year (exact figure not in retrieved text) | Prior year slightly lower | Positive single‑digit growth (approximate, based on commentary). |
| Major peer B (Baker Hughes – example from sector commentary) | Revenue up low‑ to mid‑single digits YoY (from sector recap) | Prior year lower base | Low‑ to mid‑single‑digit increase. |
How the Market Reacted?
Coverage of Halliburton’s Q1 2026 release indicates that the stock moved higher following the earnings beat. One report cited pre‑market gains of about 4.2% to roughly $37.8 per share after the company delivered EPS of $0.55 on revenue of $5.4 billion, topping consensus forecasts.
The reaction suggests investors responded positively to margin expansion and strong international growth despite flat overall revenue and softer North America results. Overall sentiment around the quarter appears constructive, with focus on profitability, cash generation, and continued shareholder returns.
