Merck reported Q1 2026 total sales of $16.3 billion, up 5% year-over-year, beating analyst estimates of $15.82 billion by approximately 3%. Non-GAAP EPS came in at a loss of $1.28 per share, better than the expected loss of $1.47, with both figures impacted by a one-time $9.0 billion Cidara acquisition charge. Shares rose roughly 5% in premarket trading on April 30, 2026.
About Merck & Co., Inc.
Merck & Co., Inc. (NYSE: MRK), known as MSD outside the United States and Canada, is one of the world’s largest biopharmaceutical companies. Founded in 1891 and headquartered in Rahway, New Jersey, the company discovers, develops, manufactures, and commercializes medicines, vaccines, and animal health products across more than 140 countries. Its two primary segments are Pharmaceutical (human health) and Animal Health, with oncology — led by KEYTRUDA (pembrolizumab) — serving as its largest revenue driver.
As of May 2026, Merck carries a market capitalization of approximately $277 billion, a P/E ratio of 31.57, a quarterly dividend of $0.85 per share, and an annual dividend yield of approximately 2.96%. The company employs approximately 69,000 people globally and is universally recognized as a premier research-intensive biopharmaceutical company.
Top Financial Highlights
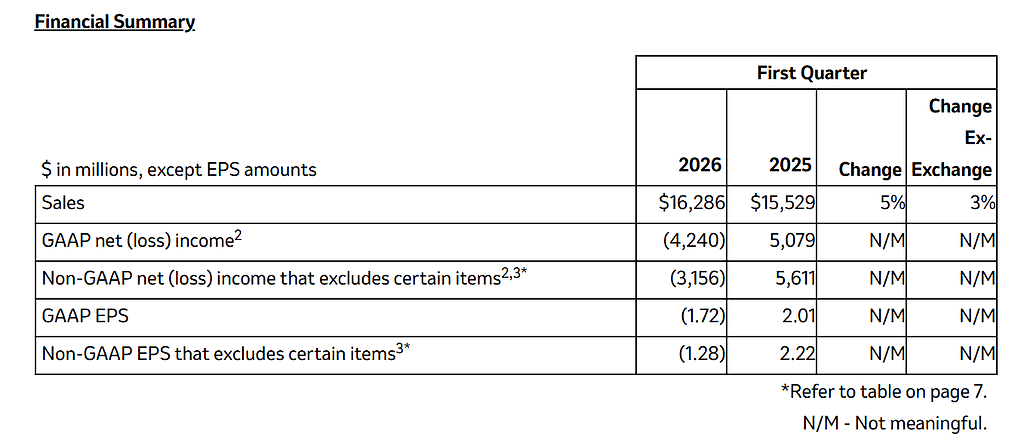
- Total worldwide sales reached $16.3 billion, a 5% increase year-over-year (3% excluding foreign exchange impact)
- GAAP net loss was $4.24 billion or $1.72 loss per share, driven entirely by a one-time $9.0 billion charge for the acquisition of Cidara Therapeutics
- Non-GAAP net loss was $3.16 billion or $1.28 loss per share, reflecting the $3.62 per share Cidara charge
- GAAP gross margin was 74.2%, down from 78.0% in Q1 2025; Non-GAAP gross margin was 81.9%, nearly flat versus 82.2% in Q1 2025
- Pharmaceutical segment revenue reached $14.35 billion, up 5% year-over-year
- KEYTRUDA and KEYTRUDA QLEX combined sales hit $8.034 billion, up 12% (8% ex-FX), including KEYTRUDA QLEX sales of $128 million
- WINREVAIR sales were $525 million, up 88% year-over-year, driven by U.S. uptake and early international launches in Japan and Europe
- Animal Health segment sales were $1.791 billion, up 13% (6% ex-FX), with growth across Livestock and Companion Animal
- WELIREG grew 45% to $199 million and PREVYMIS grew 31% to $272 million
- GARDASIL/GARDASIL 9 declined 19% to $1.069 billion on lower demand in China and Japan
- JANUVIA/JANUMET fell 28% to $574 million due to generic competition and lower demand
- Full-year 2026 revenue guidance raised and narrowed to $65.8 billion to $67.0 billion
- Full-year 2026 non-GAAP EPS guidance raised to $5.04 to $5.16 per share
Beat or Miss?
| Metric | Reported | Estimated (Consensus) | Difference / Analysis |
| Total Revenue | $16.29 billion | $15.82 billion | Beat by ~3%; 4.9% YoY growth |
| Non-GAAP EPS | ($1.28) | ($1.47) | Beat by ~13.2%; Cidara charge distorts headline |
| GAAP EPS | ($1.72) | ($1.51) | Miss; driven by non-tax-deductible $9.0B Cidara charge |
| Full-Year 2026 Revenue Guidance | $65.8B to $67.0B | ~$66.5B consensus | Roughly in line; midpoint raised |
| Full-Year 2026 Non-GAAP EPS Guidance | $5.04 to $5.16 | ~$5.07 to $5.11 | Slightly above consensus |
| KEYTRUDA / KEYTRUDA QLEX Sales | $8.034 billion | N/A | 12% growth; key outperformance driver |
| Non-GAAP Gross Margin | 81.90% | ~82% | Essentially in line |
What Leadership Is Saying?
CEO Robert M. Davis on Strategy and Vision:
“We are moving with speed to transform our portfolio to one with a diversified set of growth drivers across a broad set of therapeutic areas. During the first quarter, we continued to strengthen our pipeline with science-led business development, including our planned acquisition of Terns. We also achieved several important milestones, such as the FDA approval of IDVYNSO, which marks a new chapter in our longstanding commitment to people living with HIV. I am pleased with our progress and excited for what’s ahead, as we enter a particularly robust period of Phase 3 data readouts and deliver on the promise of our pipeline for patients.”
CFO Caroline Litchfield on Financials and Execution:
“We delivered growth in the quarter driven by continued strength in Oncology and Animal Health as well as increasing contributions from our many compelling product launches. Our commercial and operational execution continues to enable us to generate strong results in the short term while we advance our broad and deep pipeline and invest in innovation to deliver long-term value for patients, customers, and shareholders.”
Historical Performance
Year-over-year comparison of Merck Q1 2026 vs. Q1 2025:
| Category | Q1 2026 | Q1 2025 | Change (%) |
| Total Revenue | $16.29 billion | $15.53 billion | +5.0% |
| GAAP Net Income / (Loss) | ($4.24 billion) | $5.08 billion | N/M* |
| Non-GAAP Net Income / (Loss) | ($3.16 billion) | $5.61 billion | N/M* |
| GAAP Gross Margin | 74.20% | 78.00% | -3.8 pts |
| Non-GAAP Gross Margin | 81.90% | 82.20% | -0.3 pts |
| KEYTRUDA Sales | $8.034 billion | $7.205 billion | +11.5% |
| Animal Health Sales | $1.791 billion | $1.588 billion | +12.8% |
| GAAP R&D Expenses | $12.59 billion | $3.62 billion | +247.8%** |
| SG&A Expenses | $2.70 billion | $2.55 billion | +5.9% |
| GAAP EPS | ($1.72) | $2.01 | N/M* |
| Non-GAAP EPS | ($1.28) | $2.22 | N/M* |
N/M = Not Meaningful. Net income and EPS changes are not comparable due to the one-time $9.0 billion Cidara charge in Q1 2026.
**R&D spike is entirely attributable to the Cidara acquisition charge, which added $9.0 billion to R&D expenses in the quarter.*
Competitor Comparison (Q1 2026 vs. Q1 2025)
Year-over-year results across major pharmaceutical peers that have reported Q1 2026:
| Company (Ticker) | Metric | Q1 2026 | Q1 2025 | Change (%) |
| Merck (MRK) | Revenue | $16.29 billion | $15.53 billion | +5.0% |
| Merck (MRK) | Net Income / (Loss) | ($4.24 billion) | $5.08 billion | N/M |
| Johnson & Johnson (JNJ) | Revenue | $24.06 billion | $21.89 billion | +9.9% |
| Johnson & Johnson (JNJ) | Net Income | $5.24 billion | $10.99 billion | -52.4%* |
| AbbVie (ABBV) | Revenue | $15.00 billion | $13.34 billion | +12.4% |
| AbbVie (ABBV) | Net Income | $695 million | $1.29 billion | -46.1% |
| Pfizer (PFE) | Revenue | Not yet reported (May 5, 2026) | ~$13.72 billion | N/A |
How the Market Reacted?
Merck shares surged approximately 5% in premarket trading on April 30, 2026, following the stronger-than-expected Q1 results and the upward revision to full-year guidance. The market largely looked past the GAAP loss, correctly attributing it to the non-recurring $9.0 billion Cidara Therapeutics charge rather than any deterioration in the underlying business.
By the close of the session following earnings, shares posted a gain of approximately 2.73%, and the stock’s year-to-date return stood at approximately 5.36% as of early May 2026. Analyst sentiment remains broadly constructive, with a consensus rating of Moderate Buy and an average price target of approximately $128.47 per share, though Erste Group made minor downward adjustments to their FY2026 EPS estimates after the report.
