









Quick Verdict
NetEase reported Q2 2026 revenue of RMB30.1 billion ($4.4 billion), up 7.9% year over year and above consensus, while non-GAAP diluted EPS was RMB12.02 per ADS ($1.77), below estimates. The earnings miss—largely tied to investment losses—overshadowed stronger gaming margins, and NTES fell about 5.9% in regular U.S. trading.
About NetEase
NetEase, Inc. (NASDAQ: NTES; HKEX: 9999) is a China-based internet and game-services company founded in 1997 and headquartered in Hangzhou, Zhejiang. Its principal business is developing and operating mobile, PC, and console games in China and overseas. Its games portfolio includes long-running franchises such as Fantasy Westward Journey and newer global titles including Where Winds Meet and Marvel Rivals.
Beyond games, NetEase owns a majority interest in Youdao (NYSE: DAO), which provides intelligent learning and advertising solutions; operates NetEase Cloud Music (HKEX: 9899); and runs Yanxuan, a private-label consumer-lifestyle and e-commerce brand. A recent market profile put NetEase’s market capitalization at approximately $84.2 billion, and employee count at 25,382; those figures can fluctuate with the share price and reporting period.
The Q2 result illustrates the company’s current investment case: gaming-led operating momentum and substantially better gross profitability were offset by investment losses, foreign-exchange losses, and a higher effective tax rate. NetEase ended the quarter with RMB167.5 billion ($24.7 billion) in net cash, giving it considerable capacity for dividends, buybacks, content investment, and international expansion.
Top Financial Highlights
- Total Q2 revenue: RMB30.1 billion ($4.4 billion), up 7.9% year over year from RMB27.9 billion.
- H1 2026 revenue: RMB60.7 billion ($8.9 billion), up 7.0% year over year.
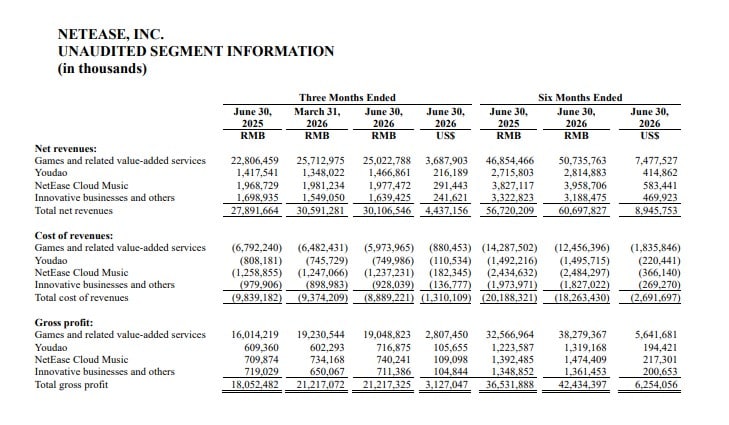
- Games and related value-added services revenue: RMB25.0 billion ($3.7 billion), up 9.7% year over year and representing roughly 83.0% of total revenue.
- Online-game revenue: approximately RMB24.5 billion, rising about 10% year over year; online games supplied 97.7% of games-and-related-VAS segment revenue
- Youdao revenue: RMB1.5 billion ($216.2 million), up 3.5% year over year, primarily due to learning-services growth.
- NetEase Cloud Music revenue: RMB2.0 billion ($291.4 million), broadly flat year over year; subscription memberships supported online music services.
- Innovative businesses and others revenue: RMB1.6 billion ($241.6 million), down 3.5% year over year, principally reflecting lower e-commerce revenue.
- Gross profit: RMB21.2 billion ($3.1 billion), up 17.5% year over year. The implied consolidated gross margin improved to 70.5%, from approximately 64.7% in Q2 2025.
- Games gross margin: 76.1%, compared with 70.2% a year earlier, helped by lower platform-related revenue-sharing costs.
- Operating expenses: RMB9.1 billion ($1.3 billion), up only 1.5% year over year. R&D expense increased to RMB4.64 billion, while selling and marketing expense was RMB3.68 billion.
- Operating profit: RMB12.1 billion ($1.8 billion), up about 33.4% year over year, benefiting from the sharp gross-profit increase and controlled operating-expense growth.
- GAAP net income attributable to shareholders: RMB7.0 billion ($1.0 billion), down 18.8% year over year from RMB8.6 billion.
- Non-GAAP net income attributable to shareholders: RMB7.7 billion ($1.1 billion), down from RMB9.5 billion a year earlier.
- Non-GAAP diluted EPS: RMB12.02 per ADS ($1.77), down from RMB14.81 per ADS in Q2 2025.marketscreener+1
- Operating cash flow: RMB10.0 billion ($1.5 billion), versus RMB10.9 billion in Q2 2025.
- Net cash: RMB167.5 billion ($24.7 billion) at June 30, 2026, up from RMB163.5 billion at December 31, 2025.
- Capital returns: The board approved a Q2 dividend of $0.096 per ordinary share, or $0.480 per ADS. NetEase had also repurchased about 24.8 million ADSs, costing roughly $2.3 billion, under its $5 billion repurchase authorization.
- Guidance: NetEase did not publish formal quantitative Q3 2026 revenue, earnings, or margin guidance. Management instead emphasized live-game operations, its upcoming-title pipeline, original gameplay, technology, and international expansion.
NetEase, Inc.Unaudited Segment Information
(Source: ir.netease.com)
Beat or Miss?
| Metric | Reported | Difference/Analysis |
| Q2 revenue | RMB30.11 billion | Above consensus of RMB29.48 billion by about RMB0.63 billion, or roughly 2.1%. |
| Q2 revenue in U.S.-dollar terms | About $4.4 billion | Market reports placed the estimate around $4.3 billion–$4.33 billion, indicating a modest top-line beat. |
| Adjusted diluted EPS per ADS | RMB12.02 | Below FactSet consensus of RMB15.56 by RMB3.54, a miss of roughly 22.8%. |
| Non-GAAP EPS per ADS | $1.77 | Below one cited consensus of $2.28, or around 22.4% under expectations. |
| GAAP attributable net income | RMB7.0 billion | Fell year over year despite stronger operating performance, largely because of a RMB2.95 billion net investment loss, exchange losses, and a higher tax charge. |
| Gross margin | 70.50% | Up from approximately 64.7% a year earlier, demonstrating meaningful core operating leverage. |
The earnings outcome was therefore mixed: NetEase beat on revenue, improved margins materially, and maintained a sizeable net-cash position, but it missed profit expectations. The lower earnings were not principally the result of a weak games operation; the release identifies the decline in the fair value of equity-security investments and impairment provisions as major drivers of unfavorable other-income movement.
What Leadership Is Saying
“Our robust performance in the first half of 2026 reflects players’ growing enthusiasm for both our newly launched and established games, underscoring our ability to create distinctive and refreshing experiences with lasting appeal.” — William Ding, Chief Executive Officer and Director.
“As we continue to strengthen both our live game operations and new title pipeline, we are sharpening our focus on original gameplay, cutting-edge technology and deeper global reach to support our enduring growth.” — William Ding, Chief Executive Officer and Director.
The earnings release itself did not include a direct quote from a titled CFO. In the earnings-call coverage, Vice President of Finance Aileen Mo attributed the year-over-year non-GAAP income decline primarily to investment losses, while highlighting Q2 revenue of RMB30.1 billion and non-GAAP net income of RMB7.7 billion.
“Our non-GAAP net income attributable to shareholders for the second quarter totaled RMB 7.7 billion or $1.1 billion, with the year-over-year decline primarily attributable to investment losses.” — Aileen Mo, Vice President of Finance.
Historical Performance
| Category | Q2 2026 | Q2 2025 | Change (%) |
| Revenue | RMB30.11 billion | RMB27.89 billion | 7.90% |
| Gross profit | RMB21.22 billion | RMB18.05 billion | 17.50% |
| Gross margin | 70.50% | 64.70% | +5.8 percentage points |
| Operating expenses | RMB9.13 billion | RMB8.99 billion | 1.50% |
| Operating profit | RMB12.09 billion | RMB9.06 billion | 33.40% |
| Net income attributable to shareholders | RMB6.98 billion | RMB8.60 billion | -18.80% |
| Non-GAAP net income attributable to shareholders | RMB7.75 billion | RMB9.53 billion | -18.70% |
| Net cash from operating activities | RMB10.0 billion | RMB10.9 billion | -8.30% |
(Source: NetEase’s unaudited Q2 2026 and Q2 2025 comparative financial statements.)
The key divergence is clear. Revenue, gross profit, and operating profit all strengthened, but attributable net income declined as non-operating items deteriorated. Investment income shifted from a RMB328.4 million gain in Q2 2025 to a RMB2.95 billion loss in Q2 2026; the tax charge also rose to RMB2.46 billion from RMB1.56 billion, with the effective tax rate increasing to 25.5% from 14.7%.
Competitor Context
NetEase did not provide a peer-comparison table, and peer reporting calendars, accounting bases, geographic exposure, and game-release timing are not directly comparable. Therefore, the following table uses NetEase’s own principal operating categories—the more supportable comparison available from the company’s Q2 release—rather than mixing unrelated peer-quarter metrics.
| Category | Q2 2026 | Q2 2025 | Change (%) |
| Games and related VAS revenue | RMB25.0 billion | RMB22.8 billion | 9.70% |
| Youdao revenue | RMB1.5 billion | RMB1.4 billion | 3.50% |
| NetEase Cloud Music revenue | RMB2.0 billion | RMB2.0 billion | Relatively stable |
| Innovative businesses and others revenue | RMB1.6 billion | RMB1.7 billion | -3.50% |
| Total revenue | RMB30.1 billion | RMB27.9 billion | 7.90% |
Games remained the decisive growth engine, accounting for nearly five-sixths of revenue and expanding faster than the consolidated business. This concentration makes future performance especially sensitive to the live-service durability of Fantasy Westward Journey, Identity V, Eggy Party, Sword of Justice, and Where Winds Meet, as well as commercial execution of new launches such as Sea of Remnants.
How the Market Reacted?
The immediate market reaction was negative. NTES shares fell more than 5% in U.S. premarket trading after the release as investors focused on the profit miss despite the revenue beat. In regular trading on August 20, the stock closed at $119.81, down $7.44, or 5.85%, from the prior session; it subsequently showed a modest 0.44% gain in extended trading.
The market’s response suggests investors gave greater weight to below-consensus EPS and the investment-loss impact than to the improved gross margin, games revenue growth, cash generation, dividend, and buyback progress.



