








Quick Verdict
Veeva Systems Q2 Fiscal 2027 Earnings were impressive as Veeva Systems delivered a strong fiscal Q2 2027, reporting GAAP diluted EPS of $1.66 and non-GAAP EPS of $2.35 on $928.0 million in revenue. Both adjusted EPS and revenue beat consensus expectations, while raised full-year guidance helped drive an approximately 9.4% after-hours stock gain.
About Veeva Systems
Veeva Systems Inc. (NYSE: VEEV) is a Pleasanton, California-headquartered provider of industry-cloud software, data, AI agents, and consulting services for life-sciences companies. Founded in 2007, Veeva supports pharmaceutical, biotechnology, medical-device, and consumer-health customers across commercial operations, clinical development, regulatory, safety, quality, and content-management workflows. It operates as a Public Benefit Corporation and reported serving more than 1,500 customers in its latest earnings release.
The company had approximately 7,928 employees, a market capitalization near $39.8 billion, and a reported P/E ratio of about 43.6x around the earnings date. Veeva does not pay a dividend. Its core growth thesis increasingly centers on the migration to Vault CRM, expansion of its R&D and Quality Cloud portfolio, and the commercialization of AI offerings such as Vault AI and Veeva Falcon.
Top Financial Highlights
- Total revenue was $928.0 million, up 18% year over year from $789.1 million.
- Subscription revenue reached $766.8 million, increasing 16% year over year.
- Professional services and other revenue totaled $161.2 million, up from $129.9 million a year earlier.
- GAAP net income increased 37% to $273.4 million.
- Non-GAAP net income rose 16% to $387.4 million.
- GAAP diluted EPS was $1.66, compared with $1.19 in fiscal Q2 2026.
- Non-GAAP diluted EPS was $2.35, versus $1.99 a year earlier.
- GAAP gross profit totaled $696.0 million, equivalent to a 75.0% gross margin.
- Non-GAAP gross margin was 77.1%; subscription gross margin was 86.2% on a GAAP basis and 86.6% on a non-GAAP basis.
- GAAP operating income rose 40% to $275.0 million, producing a 29.6% operating margin.
- Non-GAAP operating income was $415.9 million, up 18%; non-GAAP operating margin was 44.8%.
- Commercial Solutions subscription revenue was $347.4 million, up 13.0% year over year.
- R&D and Quality Solutions subscription revenue was $419.4 million, up 19.3% year over year.
- GAAP operating cash flow was $238.7 million for the quarter; first-half operating cash flow was $1.37 billion.
- Cash and cash equivalents were $1.81 billion as of July 31, while short-term investments were $5.43 billion, for $7.24 billion combined.
- Fiscal Q3 2027 guidance calls for revenue of $932 million to $935 million and non-GAAP diluted EPS of $2.33 to $2.34.
- Updated fiscal 2027 guidance calls for revenue of $3.682 billion to $3.687 billion, non-GAAP operating income of about $1.64 billion, and non-GAAP diluted EPS of about $9.21.
Beat or Miss?
| Metric | Reported | Difference/Analysis |
| Revenue | $928.0 million | Beat the $905.4 million consensus estimate by about $22.6 million, or 2.5% |
| Non-GAAP diluted EPS | $2.35 | Beat the $2.22 consensus estimate by $0.13, or about 5.9% |
| Revenue growth | 18% YoY | Accelerated modestly versus the 17% growth Veeva reported in fiscal Q2 2026 |
| Non-GAAP operating income | $415.9 million | Above the company’s prior guidance range and up 18% YoY |
| FY2027 non-GAAP EPS outlook | Approximately $9.21 | Raised from the prior $9.05 outlook; above the $9.06 analyst estimate cited in market coverage |
Veeva exceeded Wall Street expectations on both of the headline measures investors typically prioritize: adjusted EPS and revenue. The company also said fiscal-Q2 results exceeded its own guidance across all metrics, while the revised full-year outlook signals management’s confidence in continued execution and growth investments.
Condensed Consolidated Balance Sheets
(Source: ir.veeva.com)
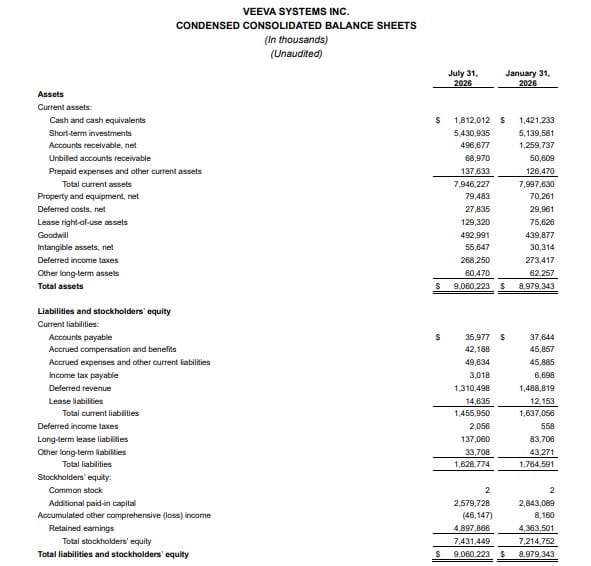
- The image presents Veeva Systems Inc.’s condensed consolidated balance sheets as of July 31, 2026, and January 31, 2026, with figures reported in USD thousands. Total assets increased slightly to USD 9.06 billion from USD 8.98 billion. Cash and cash equivalents rose to USD 1.81 billion from USD 1.42 billion, while short-term investments increased to USD 5.43 billion from USD 5.14 billion. However, accounts receivable declined significantly to USD 496.7 million from USD 1.26 billion.
- On the liabilities side, total liabilities decreased to USD 1.63 billion from USD 1.76 billion, mainly reflecting lower deferred revenue, which fell to USD 1.31 billion from USD 1.49 billion. Meanwhile, total stockholders’ equity increased to USD 7.43 billion from USD 7.21 billion, supported by retained earnings rising to approximately USD 4.90 billion from USD 4.36 billion.
- Overall, the balance sheet indicates a modest increase in total assets, lower liabilities, and a stronger equity position as of July 2026.
What Leadership Is Saying
“AI is opening up the next big chapter for Veeva and life sciences. Vault CRM had its best quarter ever and Veeva Falcon accelerated rapidly. By bringing together deep industry applications, agents, data, and consulting, we are helping the industry drive new efficiencies from clinical to commercial and deliver better outcomes for patients.”
— Peter Gassner, Chief Executive Officer
“Second quarter results exceeded guidance on all metrics and our view for the full year improved across the board. We continue to execute well across the business while also accelerating innovation and progress in new growth areas.”
— Brian Van Wagener, Chief Financial Officer
Historical Performance
| Category | Q2 FY2027 | Q2 FY2026 | Change (%) |
| Revenue | $928.0 million | $789.1 million | 17.60% |
| Net income, GAAP | $273.4 million | $200.3 million | 36.50% |
| Operating expenses, GAAP | $420.9 million | $397.9 million | 5.80% |
| Operating income, GAAP | $275.0 million | $195.9 million | 40.40% |
| Subscription revenue | $766.8 million | $659.2 million | 16.30% |
| Non-GAAP diluted EPS | $2.35 | $1.99 | 18.10% |
The margin outcome was particularly notable: revenue increased 17.6%, but GAAP operating expenses grew only 5.8%, enabling GAAP operating income to increase more than 40%. The comparison also benefits from the absence of the prior-year $30.6 million litigation settlement-related charge within G&A expenses.
Competitor Comparison
A direct same-quarter comparison should be interpreted carefully because Veeva and IQVIA have different fiscal calendars, business models, revenue bases, and accounting structures. IQVIA is a larger contract-research and analytics company, whereas Veeva is a life-sciences cloud-software specialist. The table therefore compares their most recently reported calendar Q2 2026 metrics available around Veeva’s release date.
| Category | Veeva Q2 FY2027 | IQVIA Q2 2026 | Difference/Analysis |
| Revenue | $928.0 million | $4.37 billion | IQVIA’s revenue base is much larger, driven by its CRO and commercial-services operations |
| Revenue growth | 17.6% YoY | 8.7% YoY | Veeva expanded roughly twice as fast on a reported basis |
| GAAP net income | $273.4 million | $256.0 million | Veeva generated slightly higher reported net income despite far lower revenue |
| GAAP diluted EPS | $1.66 | $1.53 | Both companies reported profitable quarters; share counts and capital structures differ |
| R&D / innovation indicator | R&D expense: $222.9 million | Adjusted EBITDA: $994 million | Not directly comparable, but highlights Veeva’s software-led investment model versus IQVIA’s services-heavy operating model |
IQVIA reported $4.368 billion of Q2 2026 revenue, including $1.793 billion from Commercial Solutions and $2.575 billion from Research & Development Solutions. Its reported GAAP net income was $256 million, and adjusted EBITDA was $994 million
How the Market Reacted?
The market reaction was distinctly bullish. Veeva closed the regular session on August 26 at $244.91, down 0.76% for the day, but shares rose approximately 9.43% in after-hours trading to $268 after the earnings release. The move reflected the dual beat on adjusted EPS and revenue, as well as higher full-year guidance and management’s emphasis on AI, Vault CRM momentum, and new-growth initiatives



