









Opening Statement
Online Shoppers Statistics: Online shopping has become a part of everyday life. People can buy clothes, groceries, electronics, books, and many other products without leaving their homes. With just a smartphone or computer, shoppers can compare prices, read reviews, and order products in a few minutes. Fast delivery, secure payment methods, and attractive discounts have made online shopping more popular than ever.
Today, online shoppers are smarter and more careful. They check product details, compare different brands, and look for the best deals before making a purchase. As technology continues to advance, online shopping is changing how people shop and helping businesses reach customers around the world.
Featured Insights
- Global online shopping revenue is projected to reach USD 6.88 trillion in 2026 and is forecast to surpass USD 10 trillion by 2033.
- Around 2.86 billion people shop online worldwide, and eCommerce is expected to account for 21.8% of all retail purchases in 2026.
- Asia Pacific remains the largest eCommerce market, valued at USD 4.1 trillion, representing 55.4% of the global market in 2026.
- China leads global eCommerce with USD 3.2 trillion in sales (43% of the global market), followed by the U.S. at USD 1.3 trillion (17.6%).
- U.S. consumers spent USD 510.455 billion on online shopping during the first 4 months of 2026, while Q1 2026 sales reached USD 302.326 billion.
- Amazon dominates U.S. retail eCommerce with a 40.5% market share, significantly ahead of Walmart (9.2%).
- Consumer electronics (USD 976 billion), fashion (USD 957 billion), and food & beverages (USD 905 billion) are expected to be the top online shopping categories in 2026.
- The global social commerce market is expected to reach USD 2.9 trillion in 2026 and grow to USD 8.5 trillion by 2030 at a 29% CAGR.
- Around 70% of online shopping carts are abandoned before purchase, mainly because of extra costs, account creation requirements, and slow delivery.
- Free shipping (50.6%) remains the leading factor influencing online purchases, while 99% of shoppers read customer reviews before making a buying decision.
Key Global Online Shopping Statistics
- According to Capitaloneshopping, the global online shopping revenue is expected to reach USD 6.88 trillion in 2026.
- Online shopping generated USD 6.42 trillion in global sales revenue during 2025.
- Global online shopping revenue grew by 6.86% in 2025 compared to 2024.
- Online sales accounted for 20.5% of total global retail sales in 2025, up from 19.9% in 2024, representing 3.02% growth.
- From 2025 to 2030, global online shopping sales are projected to grow at an average annual rate of 6.79%.
- By 2030, online shopping is expected to represent 23.9% of global retail sales.
- Around 72% of online shopping transactions take place through online marketplaces.
- Annual global online shopping revenue is forecast to reach USD 10 trillion by 2033.
Global Online Shoppers Growth
(Source: imagedelivery.net)
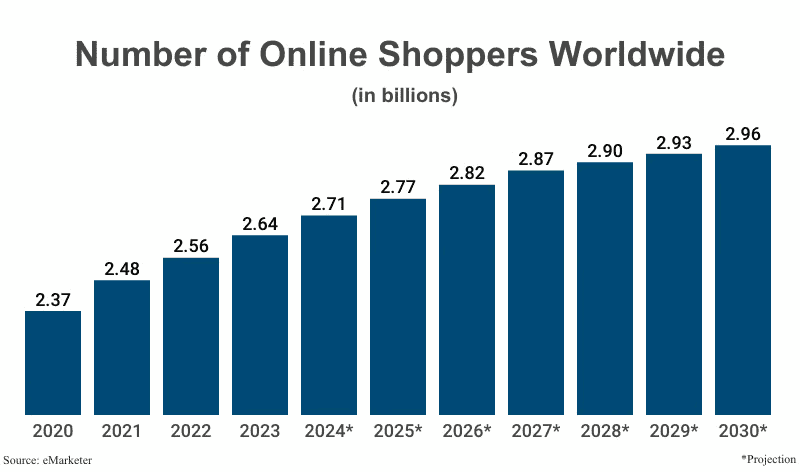
- The number of online shoppers is expected to increase from 2.77 billion in 2025 to 2.82 billion in 2026.
- By 2030, online shoppers worldwide are projected to reach about 2.96 billion.
U.S. Online Shoppers Outlook
(Reference: cdn.shopify.com)
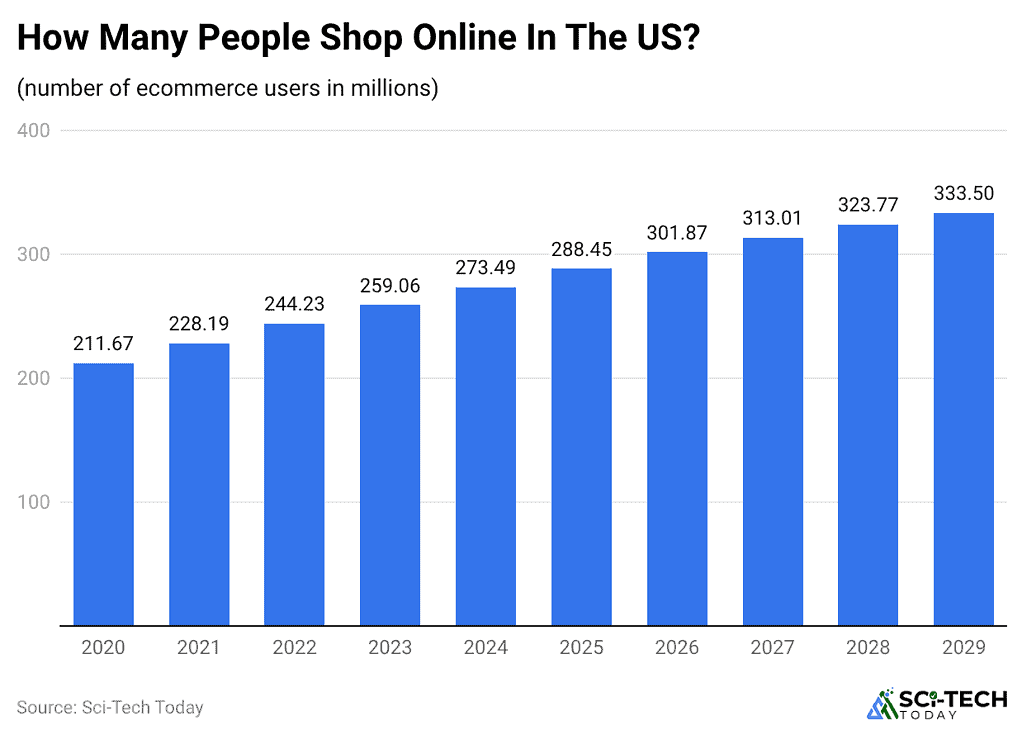
- In the US, ecommerce users are expected to rise from 288.45 million in 2025 to 301.87 million in 2026.
- By 2029, the online shopper base is projected to reach 333.50 million.
Online Retail Sales Trend
(Source: imagedelivery.net)
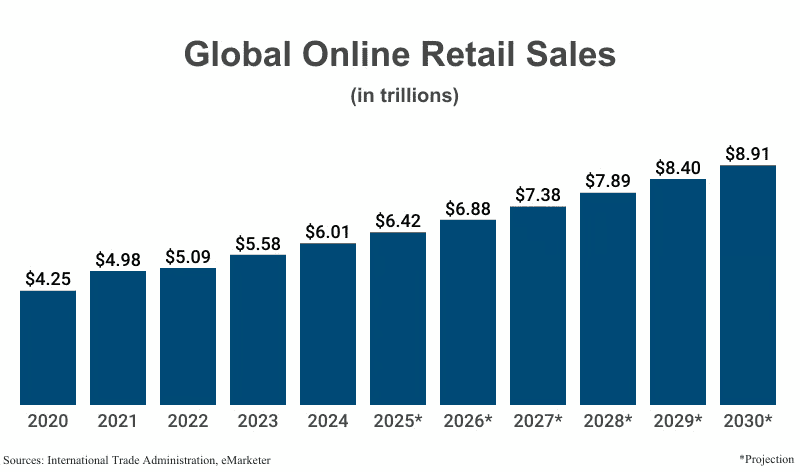
- Global online retail sales are projected to grow from about USD 6.42 trillion in 2025 to USD 6.88 trillion in 2026.
- By 2030, sales are expected to reach roughly USD 8.91 trillion.
United States Retail E‑Commerce Market Leaders
(Reference: statista.com)
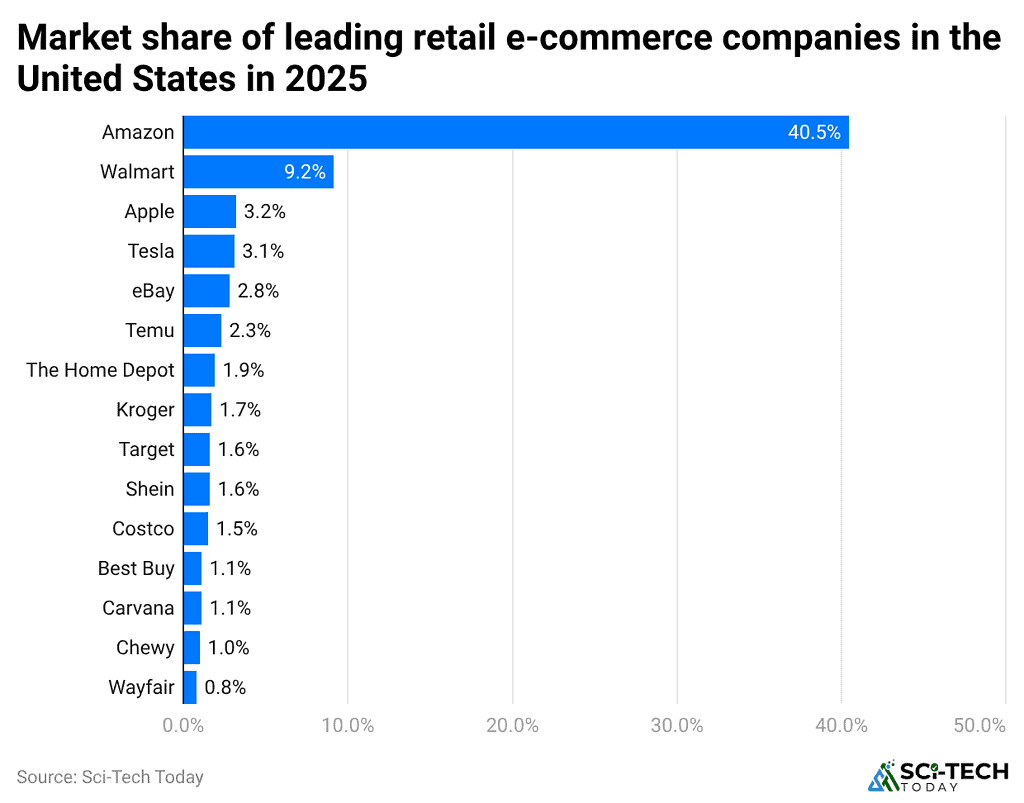
- In 2025, Amazon holds 40.5% of US retail e‑commerce sales, far ahead of Walmart at 9.2%, with Apple at 3.2% and Tesla at 3.1%, underscoring Amazon’s dominant online position.
- Other notable players include eBay at 2.8%, followed by Temu ( 2.3%), The Home Depot (1.9%), Kroger (1.7%), Target and Shein each (1.6%), Costco (1.5%), Best Buy and Carvana both (1.1%), Chewy (1%), and Wayfair (0.8%).
Global eCommerce Market Analysis
(Source: sellerscommerce.com)
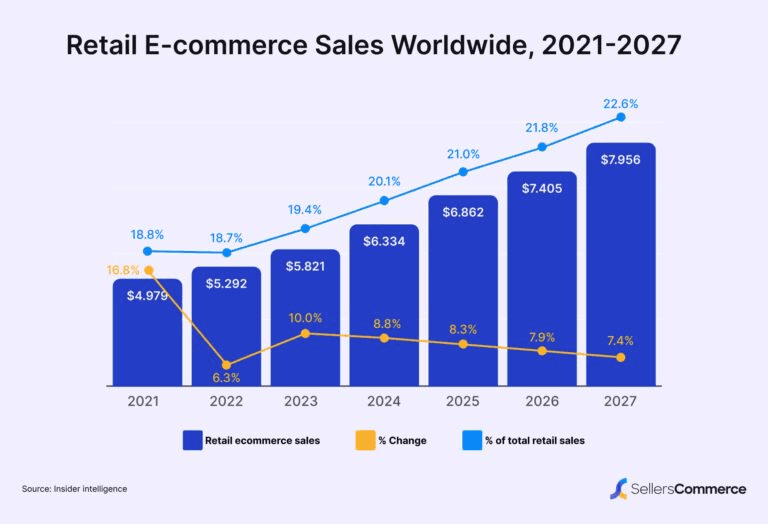
- Around 2.86 billion people shop online worldwide.
- In 2026, 21.8% of all retail purchases are expected to happen online, increasing to 22.6% in 2027.
- Global eCommerce sales are projected to exceed USD 7.4 trillion in 2026.
- More than 28 million eCommerce stores are operating worldwide.
- About 52% of online shoppers buy products from international sellers.
- Around 34% of consumers shop online at least once every week.
- Nearly 99% of shoppers read customer reviews before making an online purchase.
Regional Market Distribution
- According to Affiliate Booster, Asia Pacific is expected to remain the largest eCommerce market in 2026, reaching USD 4.1 trillion, with 13.4% growth and a 55.4% global market share.
- North America is projected to generate USD 1.5 trillion, growing 8.7% and accounting for 20.3% of the market.
- Europe is forecast to reach USD 1.2 trillion, with 9.2% growth and a 16.2% share.
- Latin America and the Middle East & Africa are expected to reach USD 387 billion and USD 214 billion, growing 16.8% and 19.3%, respectively.
Top eCommerce Markets by Country
- China leads with USD 3.2 trillion in eCommerce sales, representing 43% of global eCommerce sales.
- The U.S. ranks second at USD 1.3 trillion (17.6%).
- Other leading markets include the U.K. (USD 289 billion, 3.9%), Japan (USD 256 billion, 3.5%), Germany (USD 187 billion, 2.5%), South Korea (USD 156 billion, 2.1%), France (USD 142 billion, 1.9%), and India (USD 134 billion, 1.8%).
United States eCommerce Statistics
- According to the Capital One Shopping report, U.S. consumers spent USD 510.455 billion on online shopping during the first 4 months of 2026.
- Online sales reached USD 302.326 billion in Q1 2026, reflecting 9.65% YoY growth.
- In Q1 2026, eCommerce represented 16.8% of total U.S. retail sales, up 5.48% YoY.
- eCommerce revenue growth in Q1 2026 exceeded U.S. inflation by 197%.
- However, eCommerce’s retail share fell by 8.25 percentage points from the record 18.3% reported in Q4 2025.
- Online sales totaled USD 365.160 billion in Q4 2025, increasing 5.58% YoY.
Online Shopping Driving Factor Statistics
- In recent years, free delivery has been the top reason 63.3% of U.S. consumers choose to shop online for items.
- Coupons and discounts are important to 49.5% of people, followed by fast next-day delivery, preferred by 41.4%.
- Capital One Shopping reports that 30% of American consumers prefer to shop online, citing convenience (78%) and time-saving (69%) as primary reasons.
Most Popular Online Shopping Categories by Consumer Spending
- According to Shopify, consumer electronics are expected to lead online spending with USD 976 billion in 2026.
- Fashion follows at USD 957 billion.
- Food and beverages are projected to generate USD 905 billion.
- DIY and hardware sales are estimated at USD 395 billion.
- Furniture, media, and beauty & personal care are expected to reach USD 280 billion, USD 257 billion, and USD 251 billion, respectively.
Latin America Digital Buyers Report
(Source: eMarketer.com)
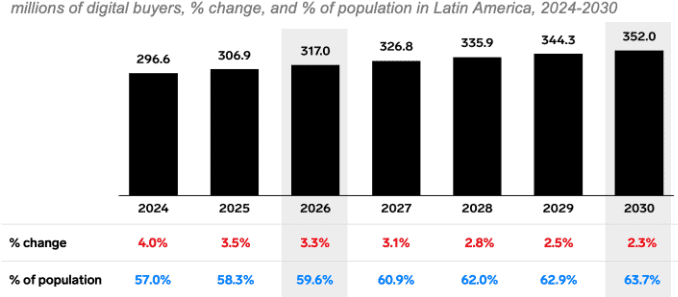
- Latin America’s digital buyers are forecast to rise from 317.0 million in 2026 to 352 million in 2030, with growth slowing from 3.3% to 2.3% but still expanding steadily.
- Over the same period, their share of the population is expected to increase from 59.6% in 2026 to 63.7% in 2030, nearing two‑thirds of all residents.
Key Social Commerce Statistics
- The global social commerce market is expected to reach USD 2.9 trillion in 2026, representing a 30.81% increase from the previous year.
- The market is projected to grow at a 29% CAGR from 2022 to 2030, reaching USD 8.5 trillion by 2030.
(Source: sellerscommerce.com)
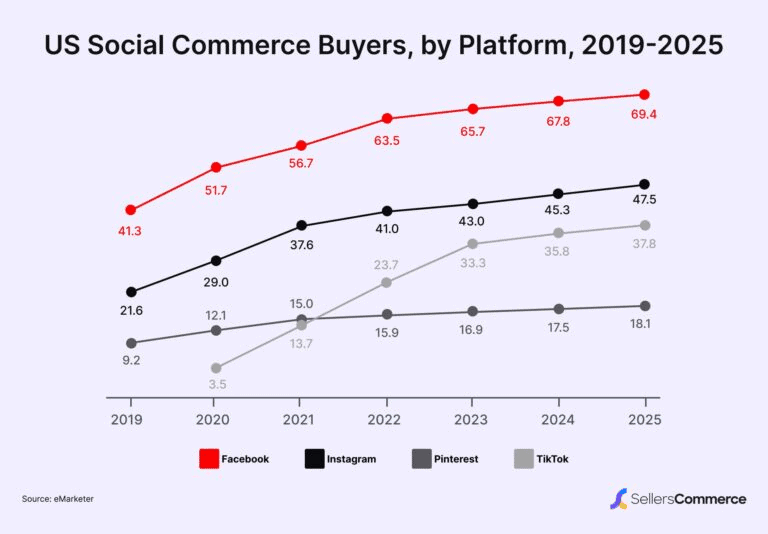
- In the U.S., Facebook is expected to lead social commerce with 74 million shoppers in 2026, followed by Instagram (47.5 million), TikTok (37.8 million), and Pinterest (18.1 million).
- Consumers aged 18-34 are the most active social commerce users, with 73% reporting purchases through social media, compared with only about 25% of people aged 65+.
- Around 19% of shoppers frequently buy health and wellness products through social media, 20% purchase personal care products 8 or more times annually, and 22% buy groceries and household supplies.
Online Shopping Frequency Statistics
- A report published by Affiliate Booster shows that around 47% of consumers shop online at least once a week.
- About 34% make an online purchase every month.
- Approximately 12% shop online once every quarter.
- Only 7% of consumers shop online rarely or just once a year.
- On average, each online shopper completes 42 purchases annually.
- The average consumer spends around USD 220 on online shopping each month.
By Time
(Reference: cdn.shopify.com)
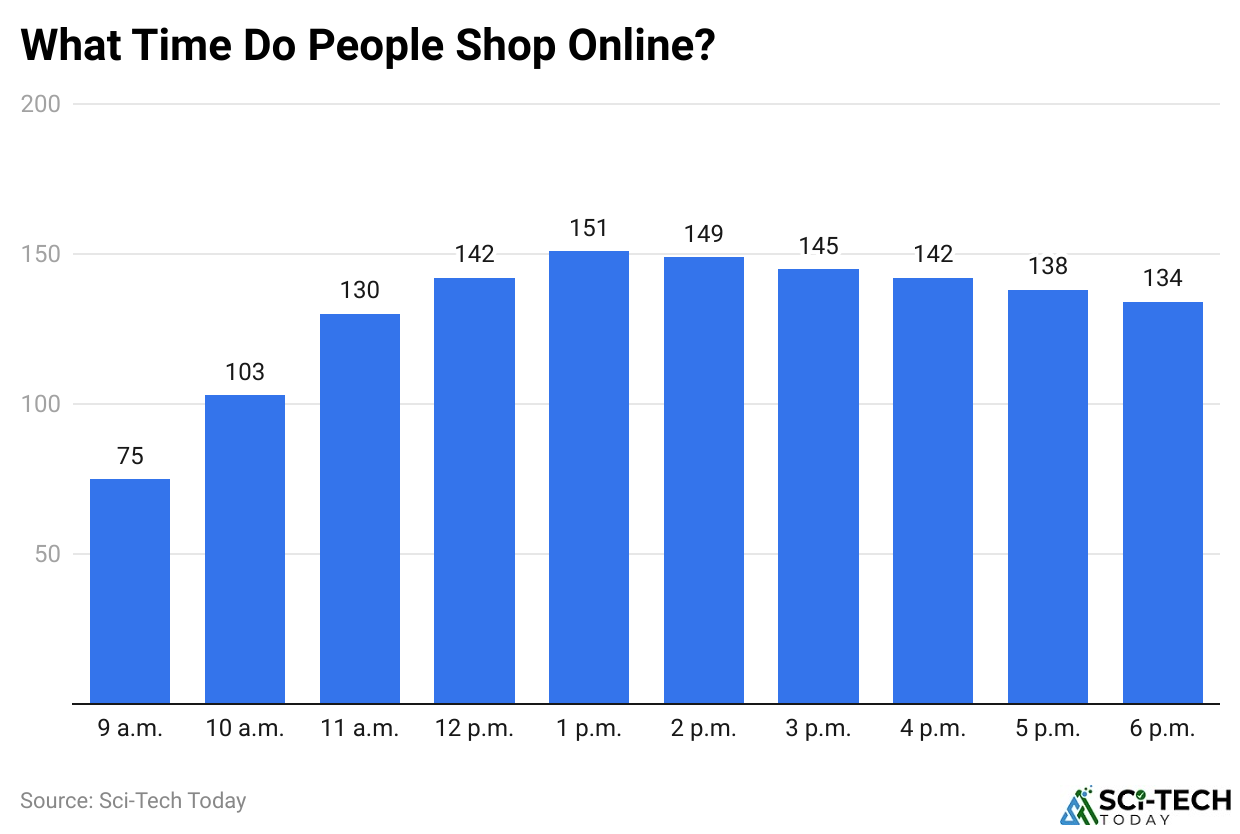
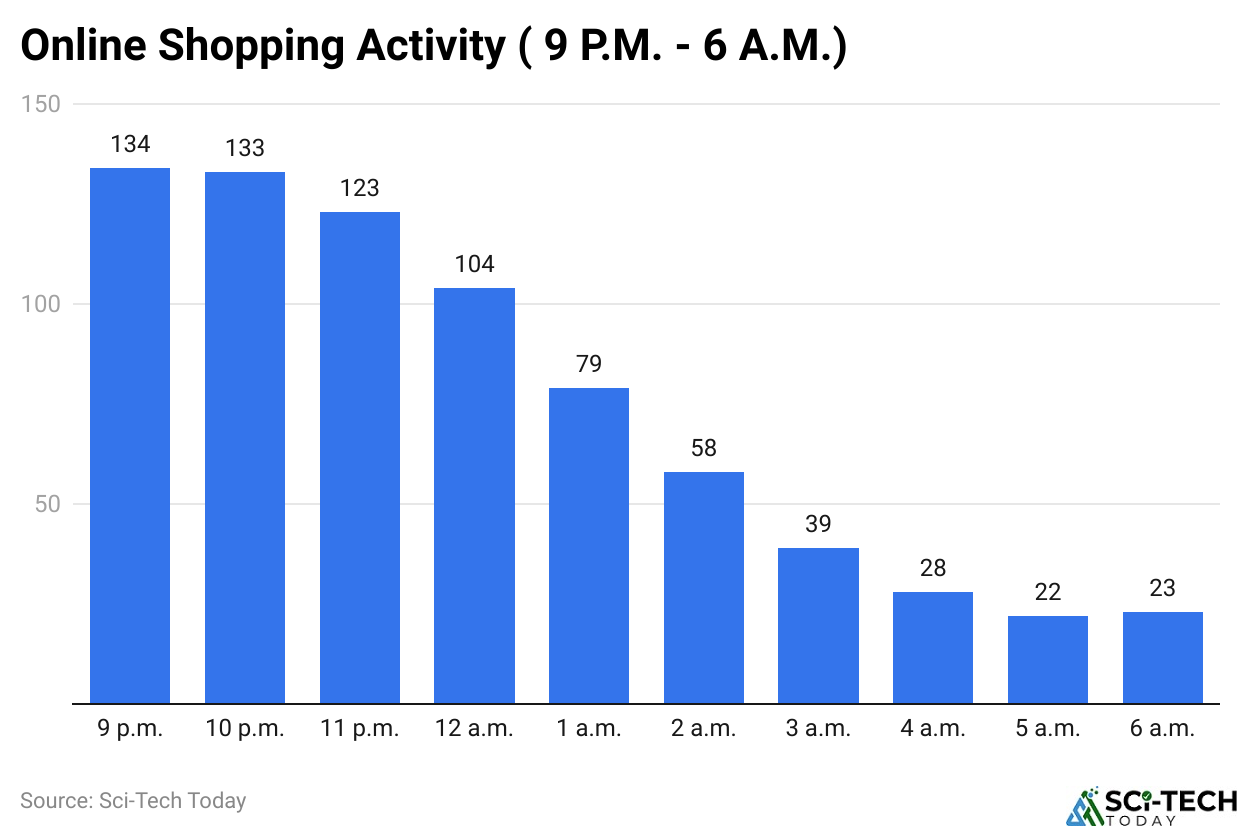
- The above graph shows that people shop online most at 1 p.m. and 2 p.m., with activity levels at 151 and 149, making these the busiest shopping times of the day.
- The second busiest time for online shopping is around lunchtime. The activity index is 145 at 3 p.m., and it is 142 at 12 p.m. and 4 p.m.
(Reference: cdn.shopify.com)
- Online Shopping Statistics further analyze that shopping slows down slightly, reaching 132 at 8 p.m., then rises to 134 at 9 p.m., peaking before 10 p.m.
- In contrast, online shopping is still active at 11 p.m., with an index of 123, but it drops to 104 at midnight.
Online Shopping Statistics by Age Distribution
- Millennials (27-42) have the highest online shopping participation, with 98% shopping online and spending an average of USD 3,124 per year.
- Gen Z (18-26) follows closely, with 96% shopping online and an average annual spend of USD 1,847.
- Gen X (43-58) accounts for 89% of online shoppers, with annual spending of USD 2,987.
- Among older consumers, 73% of Baby Boomers (59-77) and 42% of the Silent Generation (78+) shop online, spending USD 2,156 and USD 1,234 per year, respectively.
By Gender Shopping Patterns
- Women represent 51% of online shoppers, compared with 49% for men.
- Female shoppers spend an average of USD 2,834 annually, while male shoppers spend USD 2,447.
- Women mainly purchase fashion, beauty, and home goods, whereas men prefer electronics, automotive products, and sports equipment.
- Women complete 47 online purchases per year, compared with 37 for men, while men have a higher average order value (USD 73 vs. USD 61).
By Income Level
- Households earning USD 100K+ spend an average of USD 4,567 annually on online purchases.
- Annual spending averages USD 3,234 for USD 75K-100K, USD 2,456 for USD 50K-75K, USD 1,789 for USD 35K-50K, and USD 1,123 for incomes below USD 35K.
- High-income consumers shop online 2.3× more frequently than lower-income households.
United States Online Shopping Product Categories Performance
| Category | Market size 2026 (USD) | Growth Rate | Online Penetration |
| Fashion & Apparel | 1.2 trillion | 9.7% | 38% |
| Electronics | 987 billion | 8.3% | 42% |
| Food & Beverage | 624 billion | 23.8% | 12% |
| Beauty & Personal Care | 478 billion | 14.2% | 27% |
| Home & Garden | 412 billion | 11.4% | 19% |
| Toys & Hobbies | 287 billion | 13.6% | 34% |
| Books & Media | 234 billion | 6.2% | 67% |
| Health & Wellness | 198 billion | 18.7% | 21% |
Key Online Shopping Payment Method Statistics
- Digital wallets are the most popular mobile payment method, used by 56% of shoppers through services such as Apple Pay, Google Pay, and PayPal.
- Credit and debit cards account for 32% of mobile payments.
- Buy Now, Pay Later (BNPL) is preferred by 8% of users.
- Carrier billing and cryptocurrency each represent 2% of mobile payment transactions.
Online Shopping Behavior Statistics
(Source: sellerscommerce.com)
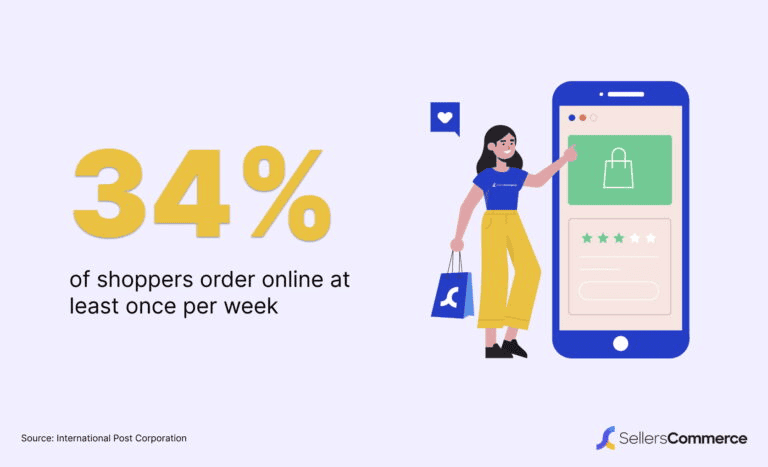
- Around 34% of consumers shop online at least once a week, while 82% make an online purchase at least once a month.
- 52% of online shoppers buy products from international sellers.
- Mexico leads cross-border shopping, with 72% of consumers purchasing from both local and international websites.
- In comparison, 63% of shoppers in the U.S. and the U.K. mainly purchase from local online stores.
- Nearly 99% of shoppers read customer reviews before buying, while 96% specifically check negative reviews.
- Around 49% trust online reviews as much as recommendations from family and friends.
Key Purchase Drivers
| Reasons to Shop Online | Share of Consumers |
| Free shipping | 50.6% |
| Coupons and discounts | 39.3% |
| Easy returns | 33.2% |
| Simple checkout | 30.6% |
| Customer reviews | 30.5% |
| Next‑day delivery | 30.4% |
| Loyalty points | 27.2% |
| Cash on delivery | 19.8% |
| Social proof | 19.4% |
| Eco‑friendly products | 18.9% |
Cart Abandonment
- The Sellers Commerce report also shows that around 70% of online shopping carts are abandoned before purchase.
- Extra costs, account creation (25%), slow delivery (24%), and poor return policies (16%) are common reasons.
- The average checkout process has 5.08 steps, while a 3-step checkout can help reduce the 22% abandonment rate.
Research, Payments, and Mobile Shopping
- About 81% of shoppers research products before buying, with 60% starting on search engines.
- 66% research on PCs or laptops, while 15% use mobile devices.
- U.S. Buy Now, Pay Later (BNPL) transactions grew from USD 116 billion in 2023 to USD 133 billion in 2024 (14% growth) and are projected to reach USD 206 billion by 2029.
- Around 40% of U.S. shoppers have used live commerce.
- More than 60% prefer mobile-friendly websites, and 84% would install a shopping app for better deals. Mobile commerce contributed 60% of global eCommerce sales in 2023.
Online Shoppers Statistics by Fraud and Consumer Trust
- ZIK Analytics further noted that global online payment fraud resulted in USD 48 billion in losses over the past year.
- North America loses around 2.4% of its eCommerce revenue to fraud each year, while Latin America records the highest losses at 4.2% of total eCommerce sales.
- 99% of online shoppers read reviews before making a purchase, and 96% pay close attention to negative reviews.
- About 70% of consumers are comfortable sharing their data if brands use it responsibly.
- However, only 33% believe companies handle their data ethically, while 42% feel their personal information is being exploited.
By Shipping and Fulfillment
- USPS is the most widely used shipping carrier among Shopify merchants, and 50.6% of global shoppers say free shipping is their top purchase motivator.
- Around 84% of online shoppers consider clear delivery timelines before completing a purchase.
- Most consumers expect standard shipping within 7–10 business days.
- Retailers using local fulfillment centers report up to 50% fewer complaints from repeat customers.
- eCommerce return rates typically range between 5% and 8%.
Wrap-Up
Online shopping is growing fast all over the world because more people have internet access, use mobile devices, and enjoy easy payment options. Shoppers like e-commerce because it’s convenient, offers many choices, and often has better prices. Trends like shopping on mobile phones, buying through social media, and getting personalized experiences are shaping the future of online stores.
Companies that focus on improving the shopping experience and fast delivery will do well in this growing market.
FAQ
It is convenient, saves time, offers more choices, and often provides better deals.
Clothing, electronics, groceries, books, beauty products, and home items are popular online purchases.
Common methods include credit cards, debit cards, digital wallets, UPI, net banking, and cash on delivery.


