









Quick Verdict
Arista Networks’ Q3 2026 earnings report shows that Arista Networks delivered Q3 2026 revenue of $3.66 billion, up 58.5%, with adjusted EPS of $1.20 and GAAP EPS of $1.22. Both revenue and adjusted earnings exceeded widely reported consensus estimates. Shares reportedly climbed 12.1% after hours as management forecast fourth-quarter revenue between $3.9 billion and $4.0 billion.
About Arista Networks, Inc.
Arista Networks, Inc. (NYSE: ANET) supplies networking platforms for artificial intelligence, cloud data centers, enterprise campuses, and routing environments. Headquartered in Santa Clara, California, the company traces its roots to Arastra, established in 2004; its corporate overview identifies 2008 as Arista’s founding and incorporation year. It went public in 2014 and joined the S&P 100 in September 2026.
Arista’s technology combines switching and routing equipment with its Extensible Operating System, or EOS, and software for automation, analytics, security, and network visibility. Its customers include major cloud providers, financial institutions, and other large enterprises. The company reports more than 5,000 employees worldwide, over 10,000 customers, and more than 150 million installed ports.
A November 3 market-data report placed its market capitalization near $213.9 billion and its P/E ratio at 53.49; these valuation measures reflect that report’s trading snapshot rather than a verified post-earnings closing valuation. AI infrastructure remains central to Arista’s strategy.
Top Financial Highlights
- Total revenue reached $3.6576 billion, up 58.5% year over year and 20.5% sequentially.
- GAAP net income increased to $1.5604 billion from $853.0 million a year earlier.
- Non-GAAP net income totaled $1.5308 billion, compared with a recast $979.4 million in Q3 2025.
- GAAP diluted EPS rose to $1.22 from $0.67; non-GAAP diluted EPS increased to $1.20 from a recast $0.77.
- GAAP gross margin declined to 63.6% from 64.6%; non-GAAP gross margin fell to 64.0% from 65.2%.
- GAAP operating margin expanded to 44.9% from 42.4%, while non-GAAP operating margin improved to 49.1% from 48.6%.
- Product revenue totaled $3.1900 billion, versus $1.9117 billion a year earlier.
- Service revenue reached $467.6 million, compared with $396.6 million. These are the release’s two revenue categories—not separately disclosed AI, campus, or routing business-unit revenues.
- Operating cash flow was $3.9774 billion for the first nine months of 2026, versus $3.1100 billion in the comparable period. The release does not separately present Q3-only operating cash flow.
- Cash and cash equivalents stood at $2.2881 billion on September 30, alongside $12.0709 billion in marketable securities—approximately $14.359 billion combined.
- GAAP operating expenses increased to $683.3 million from $512.0 million, including $486.9 million in research and development spending.
- Fourth-quarter revenue guidance is $3.9 billion–$4.0 billion, with non-GAAP operating margin of 48%–49% and non-GAAP diluted EPS of $1.26–$1.30.
- Strategic investment gains of $134.5 million were excluded from adjusted earnings. Those gains and other adjustments help explain why GAAP EPS exceeded non-GAAP EPS this quarter.
Arista Networks, Inc. Reconciliation Of Selected GAAP to Non-GAAP Financial Measures
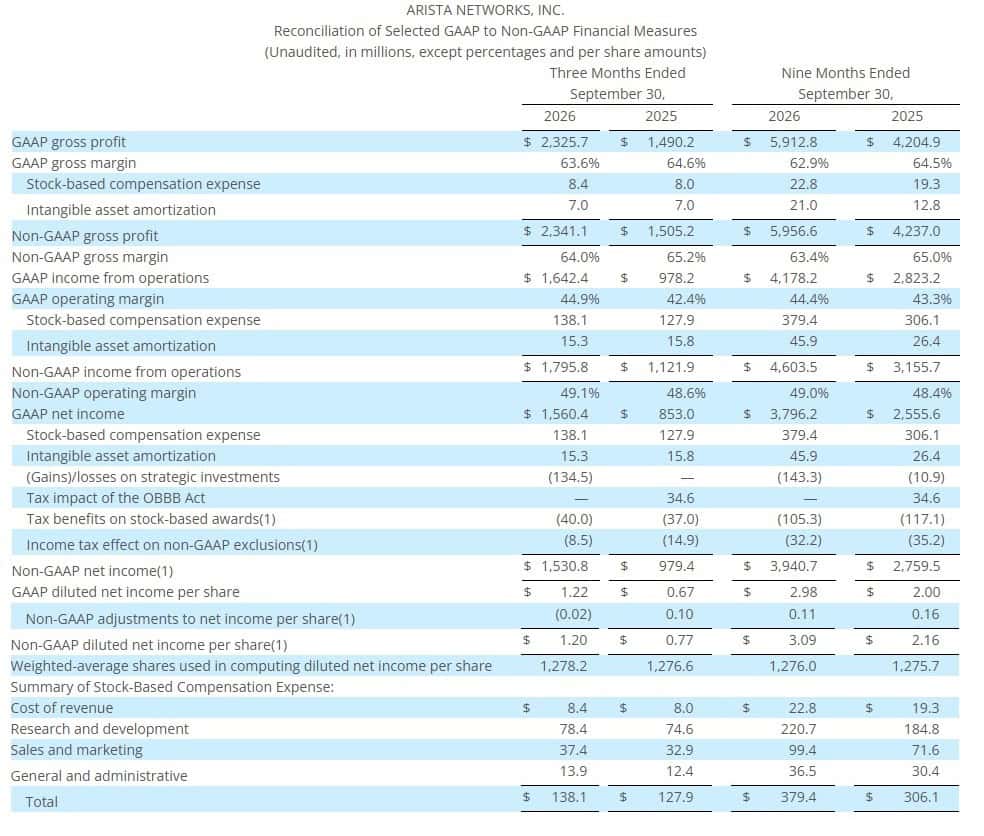
- The table presents Arista Networks, Inc.’s reconciliation of selected GAAP and non-GAAP financial measures for the three-month and nine-month periods ended September 30, 2026, compared with the corresponding periods in 2025. All financial figures are reported in millions of US dollars, except percentages and per-share amounts. The reconciliation highlights the impact of stock-based compensation expenses, intangible asset amortization, strategic investment gains or losses, and tax-related adjustments on the company’s reported profitability and operating performance.
- During the nine months ended September 30, 2026, Arista Networks reported GAAP gross profit of $5,912.8 million, compared with $4,204.9 million in the corresponding period of 2025. GAAP gross margin stood at 62.9%, while non-GAAP gross margin was higher at 63.4%, reflecting adjustments for stock-based compensation and intangible asset amortization. Non-GAAP gross profit increased to $5,956.6 million from $4,237.0 million in the previous year.
- GAAP income from operations increased to $4,178.2 million, compared with $2,823.2 million in 2025, while non-GAAP operating income reached $4,603.5 million, up from $3,155.7 million. The corresponding non-GAAP operating margin improved to 49.0% from 48.4%, indicating stronger operating profitability. GAAP net income increased to $3,796.2 million, compared with $2,555.6 million in the previous year. Similarly, non-GAAP net income reached $3,940.7 million, compared with $2,759.5 million.
- At the per-share level, GAAP diluted net income increased to $2.98, compared with $2.00 in 2025, while non-GAAP diluted net income per share rose to $3.09 from $2.16. Stock-based compensation represented the largest adjustment, totaling $379.4 million during the nine-month period, compared with $306.1 million in 2025. Research and development accounted for the largest portion of stock-based compensation expense at $220.7 million, followed by sales and marketing at $99.4 million and general and administrative expenses at $36.5 million.
- Overall, the table demonstrates improved revenue-related profitability, higher operating income, stronger net earnings, and improved diluted earnings per share. The relatively stable non-GAAP operating margin, alongside higher absolute profitability, indicates that earnings growth was supported by increased business scale while stock-based compensation and other non-cash adjustments continued to influence the difference between GAAP and non-GAAP results.
Beat or Miss?
Arista delivered a beat against the $3.33 billion revenue and $1.08 adjusted EPS consensus reported by MarketBeat and Investing.com. Its revenue also exceeded management’s stated $3.3 billion guidance.
| Metric | Reported | Difference/Analysis |
| Q3 revenue | $3.6576 billion | Approximately $327.6 million, or 9.8%, above the rounded $3.33 billion consensus. |
| Q3 non-GAAP diluted EPS | $1.20 | $0.12, or 11.1%, above the $1.08 consensus. |
| Q3 GAAP diluted EPS | $1.22 | Comparable GAAP consensus not verified; no beat/miss assigned. |
| Revenue versus company guidance | $3.6576 billion | Approximately $357.6 million, or 10.8%, above the $3.3 billion guidance cited in the release. |
| Q3 non-GAAP operating margin | 49.10% | Up 0.5 percentage points year over year; consensus not verified. |
| Q4 revenue outlook | $3.9 billion–$4.0 billion | Above the approximately $3.671 billion consensus cited by Chartmill; midpoint is about 7.6% higher. |
Consensus figures vary by provider and collection time. Chartmill, for example, cited approximately $3.397 billion in Q3 revenue and $1.10 in adjusted EPS expectations; Arista exceeded those benchmarks as well. The table uses the $3.33 billion/$1.08 pair consistently for the headline quarterly comparison rather than mixing estimate sets.
What Leadership Is Saying
Chairperson and CEO Jayshree Ullal connected the quarter’s momentum to Arista’s expanding role in AI infrastructure:
“This strong momentum across customer sectors highlights our increased relevance for the generative and agentic AI era.”
CFO Chantelle Breithaupt emphasized the financial records:
“This quarter brought a true trifecta for our company, setting new record highs in revenue growth, net income, and EPS. I’m incredibly proud of the Arista team for their hard work in driving such outstanding performance for our shareholders.”
The financial statements show an important distinction behind that optimism: operating margins improved even as gross margins declined. Revenue grew substantially faster than operating expenses, allowing more revenue to flow through to operating profit.
Historical Performance
Arista Networks: Q3 2026 versus Q3 2025
Amounts are in millions of U.S. dollars, except per-share figures and margins. Percentage changes use the financial statements accompanying the release.
| Category | Q3 2026 | Q3 2025 | Change (%) |
| Revenue | $3,657.60 | $2,308.30 | 58.50% |
| GAAP net income | $1,560.40 | $853.00 | 82.90% |
| GAAP operating expenses | $683.30 | $512.00 | 33.50% |
| GAAP operating income | $1,642.40 | $978.20 | 67.90% |
| Product revenue | $3,190.00 | $1,911.70 | 66.90% |
| Service revenue | $467.60 | $396.60 | 17.90% |
| GAAP diluted EPS | $1.22 | $0.67 | 82.10% |
| Non-GAAP diluted EPS | $1.20 | $0.77 | 55.80% |
| GAAP gross margin | 63.60% | 64.60% | −1.0 percentage point |
Product revenue drove the expansion, rising considerably faster than service revenue. Meanwhile, operating expenses grew 33.5% against revenue growth of 58.5%, explaining the improvement in operating margin despite lower gross profitability per dollar of sales.
Competitor benchmark: Cisco Systems
Cisco provides a relevant networking-industry benchmark, but its fiscal calendar differs from Arista’s. The verified Cisco release used here covers Q4 fiscal 2026, ended July 25, 2026, rather than Arista’s September quarter. It therefore provides a year-over-year peer comparison—not a synchronized Q3 comparison. No unverified competitor results are substituted for missing same-period data.
Amounts are in millions of U.S. dollars.
| Category | Cisco Q4 FY2026 | Cisco Q4 FY2025 | Change (%) |
| Revenue | $17,252 | $14,673 | 17.60% |
| GAAP net income | $3,859 | $2,550 | 51.30% |
| GAAP operating expenses | $6,799 | $6,193 | 9.80% |
| GAAP operating income | $4,264 | $3,087 | 38.10% |
| GAAP diluted EPS | $0.97 | $0.64 | 51.60% |
Arista’s 58.5% revenue growth exceeded Cisco’s 17.6% in these respective quarters, while Cisco remained much larger by total revenue. The comparison has limits: Cisco’s results include security, collaboration, observability, and services alongside networking, so consolidated growth does not establish relative AI-networking market-share gains.
How the Market Reacted?
Arista shares closed the November 3 regular session at $169.91, up 3.52%, before reportedly rising 12.1% to $190.46 in after-hours trading. An earlier report described an approximately 8% after-hours gain, underscoring that these figures represent different trading snapshots rather than one fixed closing price.
The positive reaction accompanied an earnings beat and a fourth-quarter outlook pointing to further sequential revenue growth. Investors nevertheless face a margin trade-off: operating profitability improved, but gross margins declined, and management continues to flag customer concentration, supply constraints, and revenue volatility as risks.