








Quick Verdict
Calfrac Well Services (TSX: CFW) posted Q2 2026 revenue of $426.7 million, up 6% year-over-year and well above FactSet’s $367 million consensus estimate. These Calfrac Well Services Q2 2026 Earnings results also saw diluted EPS come in at $0.32, more than double last year’s $0.17. Shares climbed 5.8% to close near C$7.29, extending a rally that has more than doubled the stock since January.
About Calfrac Well Services
Calfrac Well Services Ltd. (TSX: CFW) is a Calgary-based oilfield services provider specializing in hydraulic fracturing, cementing, coiled tubing, and wireline services for exploration and production companies across North America and Argentina. The company’s shares trade on the Toronto Stock Exchange, with a 52-week range of roughly C$2.96 to C$7.20 and a current price near C$6.89 to C$7.29 following the earnings release.
Calfrac has undergone significant balance-sheet repair over the past year, including a December 2025 rights offering that restated per-share figures. Leadership includes CEO Tyler Dahlseide and CFO Scarlett Crockatt, who run the business from headquarters at Suite 601, 407-8th Avenue S.W., Calgary, Alberta. The stock’s 1-year total return stands at roughly 12.3%, though it remains down over the trailing five years.
Top Financial Highlights
- Revenue of $426.7 million for Q2 2026, up 6% from $402.3 million in Q2 2025, driven by stronger North American activity and utilization
- Adjusted EBITDA of $73.8 million (17% of revenue), down 4% from $77.0 million (19% of revenue) a year earlier, as Argentina pricing normalized
- Net income of $31.8 million, up 108% from $15.3 million in Q2 2025
- Diluted EPS of $0.32, versus $0.17 in the prior-year quarter
- Gross profit of $57.7 million in Q2 2026 versus $55.1 million in Q2 2025
- Six-month revenue of $732.1 million, down from $772.3 million in H1 2025
- Six-month net income of $50.7 million, up sharply from $20.4 million in H1 2025
- Cash flow from operating activities of $40.9 million in Q2, down 44% from $73.5 million a year earlier
- Free cash flow of $29.5 million, roughly flat year-over-year
- Capital expenditures of $15.1 million, a 63% reduction from $40.8 million in Q2 2025
- Cash and cash equivalents of $9.5 million at quarter-end, up 42% from $6.7 million at December 31, 2025
- Net debt fell 36% since year-end 2025 to $125.8 million, the lowest level in more than a decade
- Repatriated US$18.1 million of cash from Argentina during the quarter
- Board approved a Normal Course Issuer Bid to repurchase up to 5.0 million shares (~5% of shares outstanding)
- Post-quarter, the board approved an incremental $22.6 million of 2026 capex for Argentina coiled tubing and cementing expansion
Financial Review
(Source: tricanwellservice.com)
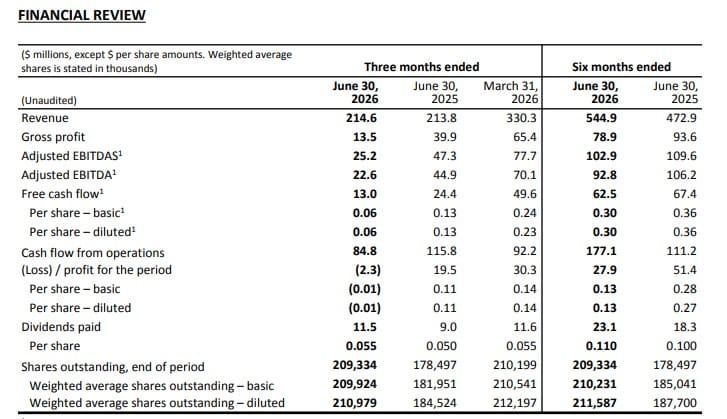
- The financial review indicates that revenue remained resilient, but profitability weakened materially during Q2 2026. Revenue reached USD 214.6 million, broadly stable compared with USD 213.8 million in Q2 2025, but significantly below USD 330.3 million in Q1 2026. Despite stable year-on-year revenue, gross profit declined to USD 13.5 million from USD 39.9 million, pointing to considerable margin pressure during the quarter.
- Adjusted EBITDA also contracted sharply. Adjusted EBITDA stood at USD 25.2 million, compared with USD 47.3 million a year earlier, while the second reported adjusted EBITDA measure declined to USD 22.6 million from USD 44.9 million. Free cash flow decreased to USD 13.0 million from USD 24.4 million, although it remained positive. Cash flow from operations reached USD 84.8 million, down from USD 115.8 million in Q2 2025.
- The company recorded a USD 2.3 million loss for Q2 2026, compared with a USD 19.5 million profit in the same quarter of 2025. Basic and diluted earnings per share consequently moved to a loss of USD 0.01 per share, versus earnings of USD 0.11 per share a year earlier.
- For the first six months of 2026, revenue increased 15.2% year-on-year to USD 544.9 million, from USD 472.9 million. However, gross profit declined to USD 78.9 million, and profit for the period fell to USD 27.9 million from USD 51.4 million. In contrast, operating cash flow strengthened substantially to USD 177.1 million, compared with USD 111.2 million in the first half of 2025.
- Overall, the figures show stronger year-to-date revenue and cash generation but considerable pressure on margins and earnings. The increase in shares outstanding to 209.3 million, from 178.5 million a year earlier, is also notable, as the larger share base can dilute per-share earnings even when operating performance improves.
Adjusted EBITDA and adjusted EBITDAS
(Source: tricanwellservice.com)
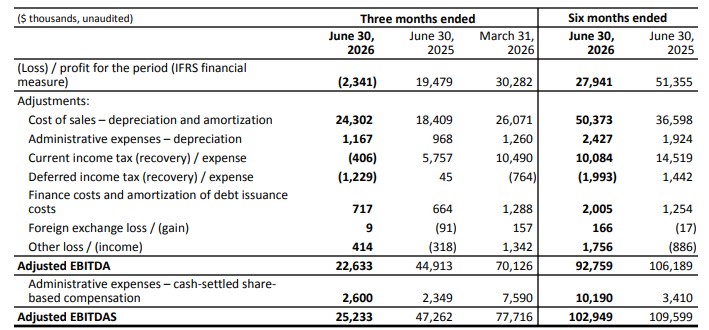
- The items excluded from the calculation of Adjusted EBITDA have been specifically identified because they are non-cash in nature, subject to significant period-to-period volatility, or not directly related to the Company’s core business activities. The non-GAAP Adjusted EBITDA calculation excludes non-cash expenses such as depreciation, amortization, impairment of non-financial assets, and equity-settled share-based compensation.
- It also excludes financial income and expenses, including foreign exchange expenses and finance costs, as well as taxation across different jurisdictions. In addition, other income or expenses, mainly arising from the disposal of equipment, are excluded because these transactions generally do not reflect the Company’s regular quarterly operational activity.
Beat or Miss?
| Metric | Reported | Difference/Analysis |
| Revenue | $426.7 million | Beat FactSet consensus of $367 million by roughly 16% |
| Diluted EPS | $0.32 | No formal consensus tracked by MarketBeat, but result more than doubled the year-ago figure |
| Adjusted EBITDA | $73.8 million (17% margin) | Down 4% YoY as Argentina pricing normalized against a stronger comparable |
| Net Income | $31.8 million | Up 108% YoY, driven by stronger operations and lower interest expense |
| Free Cash Flow | $29.5 million | Roughly flat YoY despite the revenue increase |
| Net Debt | $125.8 million | Down 36% from year-end 2025, a decade-low level |
What Leadership Is Saying
CEO Tyler Dahlseide framed the quarter around balance-sheet strength and disciplined reinvestment:
“Through the first half of the year, Calfrac has continued to generate meaningful free cash flow, materially strengthening our balance sheet and enhancing our financial flexibility… I strongly believe the Company’s position, strategy, and industry tailwinds put us in the best position we have been in quite some time.”
Historical Performance (Q2 2026 vs Q2 2025)
| Category | Q2 2026 | Q2 2025 | Change (%) |
| Revenue | $426.7 million | $402.3 million | 6% |
| Net Income | $31.8 million | $15.3 million | 108% |
| Adjusted EBITDA | $73.8 million | $77.0 million | -4% |
| Capital Expenditures | $15.1 million | $40.8 million | -63% |
Competitor Comparison (Q2 2026 vs Q2 2025)
North American pressure pumping peers posted a mixed quarter, underscoring Calfrac’s relative outperformance on both revenue growth and profitability.
| Company | Revenue Q2 2026 | Revenue Q2 2025 | Net Income/(Loss) Q2 2026 | Net Income/(Loss) Q2 2025 |
| Calfrac (CFW) | $426.7 million (+6%) | $402.3 million | $31.8 million (+108%) | $15.3 million |
| ProPetro (PUMP) | $305.8 million (-6.3%) | $326.2 million | ($8.0) million loss | Prior-quarter loss of $4.0 million (sequential comparison |
| Trican Well Service (TCW) | $214.6 million (+0.4%) | $213.8 million | ($2.3) million loss | $19.5 million profit |
Calfrac was the only one of the three to grow both revenue and net income year-over-year, while ProPetro posted a wider net loss on an annual basis and Trican swung from a $19.5 million profit to a $2.3 million loss amid seasonal softness and margin pressure.
How the Market Reacted?
Calfrac shares rose 5.8% to close near C$7.29 on the day following the results, extending a powerful year-to-date rally that has taken the stock from roughly C$4.17 at the start of 2026 to over C$7.00, a gain exceeding 75%. The reaction reflects a broadly bullish sentiment toward the quarter, driven by the revenue beat against consensus, the doubling of net income, and the milestone decade-low net debt level.
Investors appear to be crediting management’s debt-reduction progress and the newly approved share buyback program as signals of improved financial flexibility, even as Adjusted EBITDA margin compressed slightly due to Argentina pricing normalization.

Sources


