









Quick Verdict
The Finance of America Q2 2026 Earnings results are in: Finance of America reported Q2 2026 adjusted EPS of $0.84 and revenue of $62.5 million, missing consensus estimates, while GAAP diluted EPS was a $1.28 loss. Shares rose 1.71% to $23.76 before slipping 0.21% after hours, as investors balanced cash generation and reaffirmed full-year guidance for the 2026 outlook.
About Finance of America
Finance of America Companies Inc. (NYSE: FOA) is a Plano, Texas-based financial-services company founded in 2013. It provides home-equity financing for retirement, principally through Home Equity Conversion Mortgages (HECMs), non-agency reverse mortgages, loan securitization, servicing oversight, asset management, and portfolio-management activities. Its two operating segments are Retirement Solutions and Portfolio Management. CEO Graham A. Fleming leads the business, which had 783 employees in the latest company profile data.
FOA’s latest quoted market capitalization was approximately $195.0 million, based on a $21.82 share price; the displayed trailing P/E was negative at -60.61, and its dividend yield was 0%. These figures should be treated cautiously because the company’s Class B ownership structure and recent reporting changes can affect market-cap presentation. The earnings release also put common book value at $33.20 per share and tangible equity at $13.31 per share at June 30, 2026.ft
Top Financial Highlights
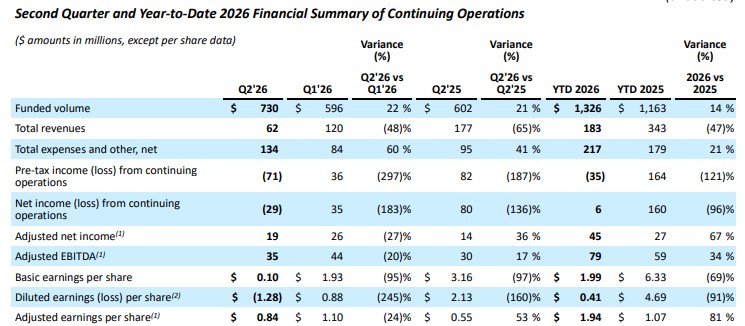
- Total revenue was $62.5 million, down about 65% YoY from $177.4 million, largely reflecting negative portfolio fair-value changes.
- GAAP net loss from continuing operations was $29 million, versus $80 million of income in Q2 2025.
- Net income attributable to Class A common shareholders was $1 million, equal to $0.10 basic EPS.
- Diluted GAAP EPS was a loss of $1.28, compared with earnings of $2.13 a year earlier.
- Adjusted net income was $19 million, or $0.84 per share—an adjusted EPS increase of 53% YoY from $0.55.
- Adjusted EBITDA reached $35 million, up 17% YoY from $30 million.
- Gross margin was not reported/not meaningful in the conventional sense for this financial-services lender; operating performance is better assessed through originations, adjusted net income, and fair-value changes.
- Operating cash flow under GAAP was negative $183.3 million; separately, management reported $58 million of cash generation from originations and capital-markets activities. These are not equivalent measures.
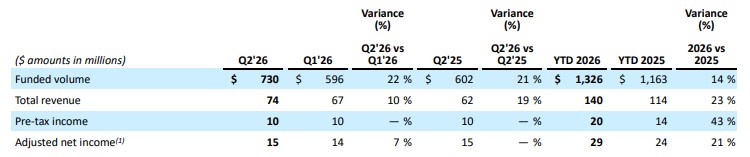
- Retirement Solutions revenue increased 19% YoY to $74 million; funded volume climbed 21% to $730 million, and revenue margin was 10.1%.
- Portfolio Management revenue fell to $1 million from $130 million, and the segment reported a $26 million pre-tax loss, primarily due to non-cash fair-value adjustments.
- Cash and cash equivalents were $85 million, up 85% YoY from $46 million, though down from $108 million at Q1-end.
- Total equity was $407 million; tangible equity was $246 million.
- Management reaffirmed full-year 2026 guidance: funded volume of $2.8 billion–$3.1 billion and adjusted EPS of $4.50–$5.00. It did not issue specific Q3 guidance.
- FOA completed the Onity HECM servicing-portfolio acquisition; management expects the roughly $70 million asset to yield in the mid-teens, with its contribution already included in 2026 guidance.
Second Quarter and Year-to-Date 2026 Highlights
(Source: s205.q4cdn.com)
Segment Results
(Source: s205.q4cdn.com)
- Funded volume increased 21% year-over-year to USD 730 million in the quarter, compared with USD 602 million in Q2 2025, supported by rising demand for home equity solutions. Total revenue grew 19% year-over-year to USD 74 million, while revenue margins remained relatively stable at 10.1%.
- Profitability also improved as larger scale supported stronger operating leverage. During the first half of 2026, pre-tax income increased 43% to USD 20 million, from USD 14 million in the first half of 2025. Adjusted net income rose 21% to USD 29 million, compared with USD 24 million a year earlier, broadly in line with revenue growth.
Beat or Miss?
FOA missed expectations on adjusted EPS and revenue. Consensus figures vary by data provider: MarketBeat showed $1.04 adjusted EPS and $121.94 million revenue, while Investing.com cited $1.12 and $128.96 million, respectively. The table uses the more widely reported $1.04/$121.94 million consensus snapshot and distinguishes adjusted from GAAP EPS.
| Metric | Reported | Difference/Analysis |
| Adjusted EPS | $0.84 | Missed $1.04 consensus by $0.20 per share |
| Revenue | $62.48 million | Missed $121.94 million consensus by $59.46 million |
| GAAP diluted EPS | ($1.28) | Not directly comparable with adjusted-consensus EPS; loss reflected major non-cash valuation and convertible-note adjustments |
| Adjusted net income | $19 million | Increased 36% YoY, despite the consensus miss |
| Full-year adjusted EPS guidance | $4.50–$5.00 | Reaffirmed; management did not lower its outlook |
What Leadership Is Saying
CEO Graham Fleming positioned Q2 as evidence that FOA’s operating investments are becoming more productive and scalable:
“The second quarter of 2026 reinforced what we’ve been communicating over the past several quarters: that the operational improvements and investments we have made are now translating into a stronger, more scalable business. Demand is strengthening, conversion and sales productivity are improving, and our proprietary products are expanding the ways we can serve older homeowners.”
CFO Matt Engel separated underlying operations from GAAP volatility caused by fair-value marks and convertible-note accounting:
“While these accounting adjustments can create meaningful quarter-to-quarter volatility in our GAAP earnings, they do not affect the underlying operating performance or cash generation of the business. We believe that adjusted net income continues to provide the clearest picture of the underlying earnings power of FOA.”
Historical Performance
| Category | Q2 2026 | Q2 2025 | Change (%) |
| Revenue | $62 million | $177 million | -65% |
| Net income/(loss) from continuing operations | $(29) million | $80 million | -136% |
| Total expenses and other, net | $134 million | $95 million | 41% |
| Adjusted net income | $19 million | $14 million | 36% |
| Funded volume | $730 million | $602 million | 21% |
The key contrast is between improved core origination activity and a sharply weaker GAAP revenue/net-income outcome. Retirement Solutions produced higher volume and revenue, but Portfolio Management absorbed $84 million of negative fair-value adjustments amid interest-rate movements, depressing consolidated GAAP results.
Competitor Historical Performance
Rocket Companies and UWM Holdings are among FOA’s listed mortgage-industry peers, although neither is a perfect operating comparator because FOA is concentrated in reverse mortgages and home-equity retirement solutions. The finance dataset did not return comparable consolidated-revenue fields for the peers; the available net-income and SG&A figures show that industry earnings also remained highly variable.
| Category | Q2 2026 | Q2 2025 | Change (%) |
| Rocket Companies net income | $229.0 million | $34.0 million | 574% |
| Rocket Companies SG&A expense | $859.0 million | $563.0 million | 53% |
| UWM Holdings net income/(loss) | $(451.9) million | $314.5 million | -244% |
| UWM Holdings SG&A expense | $125.3 million | $86.4 million | 45% |
How the Market Reacted?
FOA shares closed the August 4 regular session at $23.76, up 1.71% from the prior close, then edged down 0.21% in after-hours trading. The muted immediate reaction suggests investors weighed the large revenue and adjusted-EPS shortfall against higher funded volume, $58 million of operational cash generation, and reaffirmed 2026 guidance.
As of the latest available quote, FOA traded at $21.82, down 1.36% in that session, underscoring continued sensitivity to valuation marks, interest rates, and execution against the guidance range.

Sources


