
Introduction
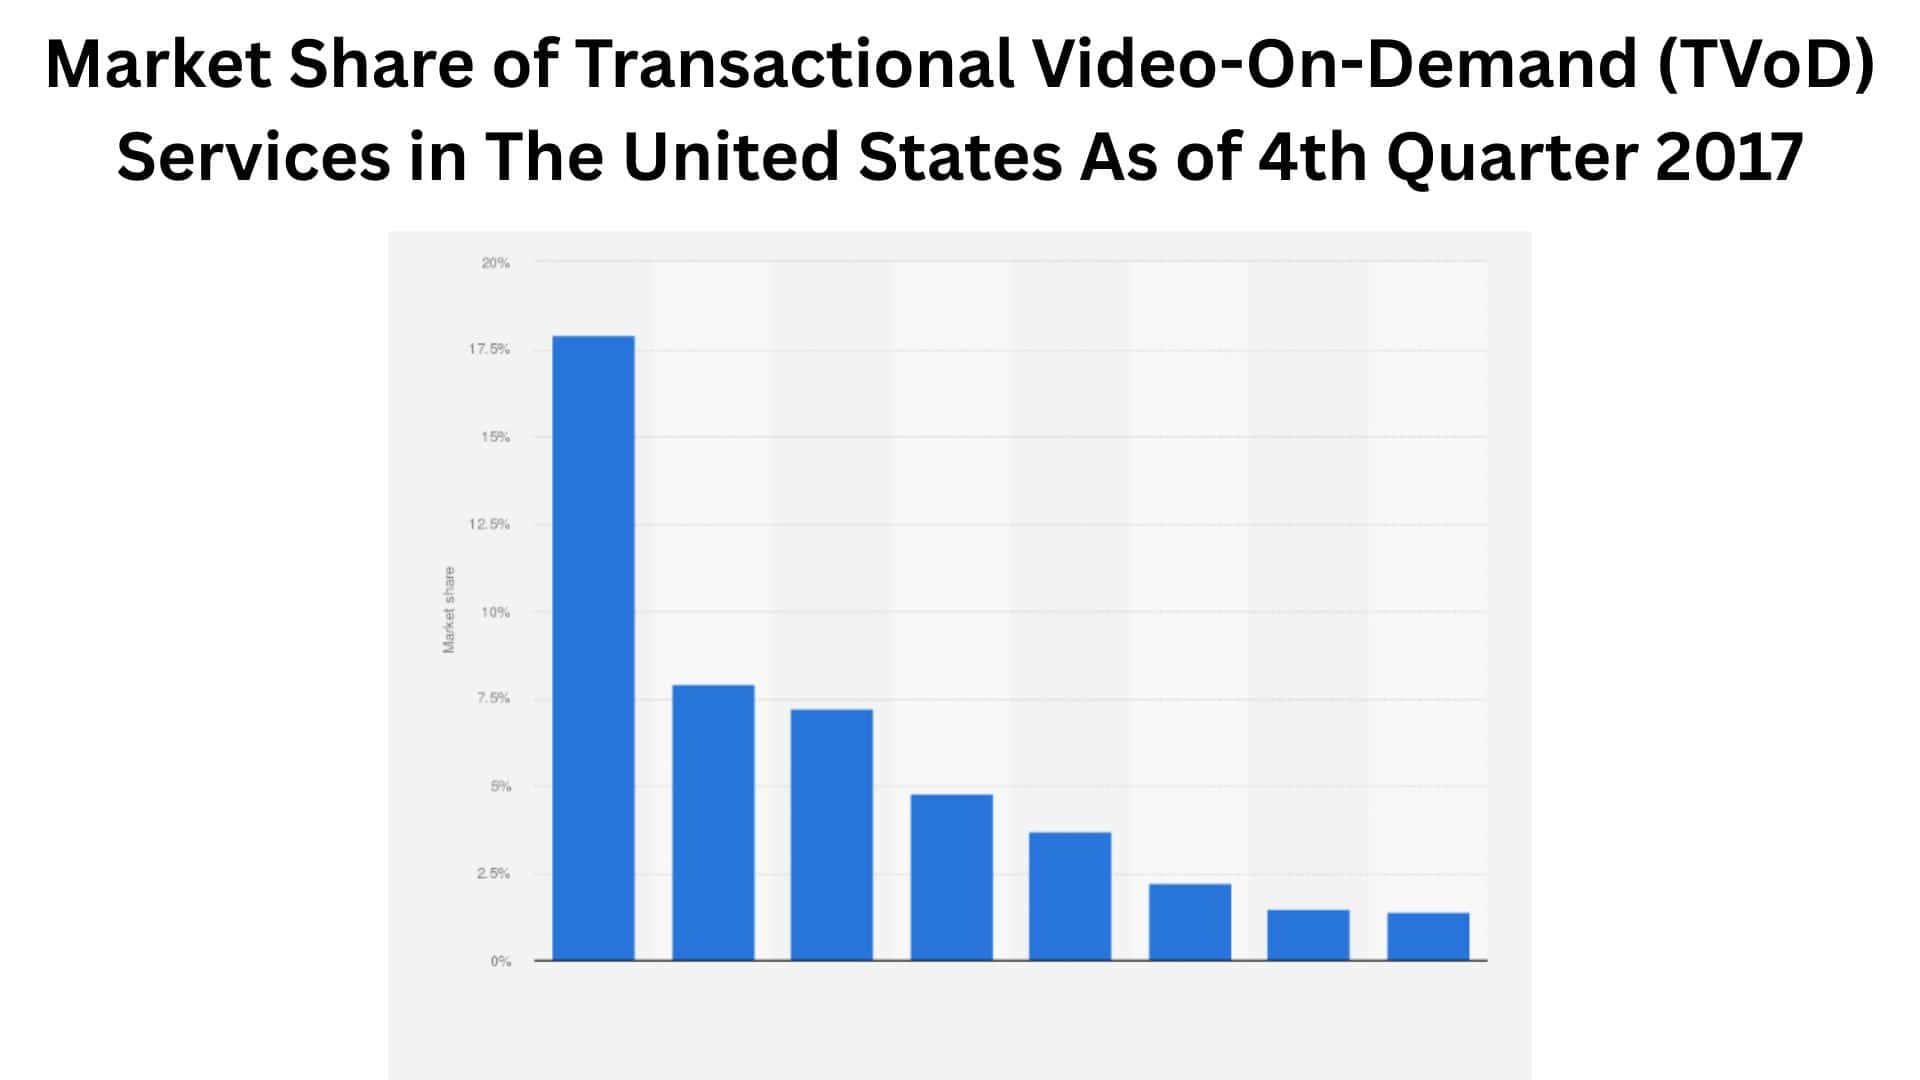
Pay-per-View Statistics: PPV, often referred to as Transactional Video on Demand (TVoD), is a vital revenue stream. It is highly profitable within the global Over-The-Top (OTT) media ecosystem.
This model differentiates itself by charging consumers a one-time fee for specific content. This includes either a temporary rental or a permanent digital purchase. It thrives on exclusivity and immediacy, primarily capitalizing on blockbuster film releases and high-stakes live events.
Unlike the flat-rate, all-access model of Subscription Video on Demand (SVOD), the Pay-per-View (TVoD) structure allows content owners to maximize revenue. They achieve this by focusing on their most valuable assets (films) and setting prices based on content demand rather than library volume.
This article dissects the core metrics, market projections, and consumer behavior. These elements drive the growth of Pay-per-View (TVoD) into a multi-billion-dollar industry segment. Let’s get started.
Editor’s Choice
- The global Video On Demand (VOD) market size was valued at an impressive USD 113.78 billion in 2024 and is projected to surge to USD 381.16 billion by 2032.
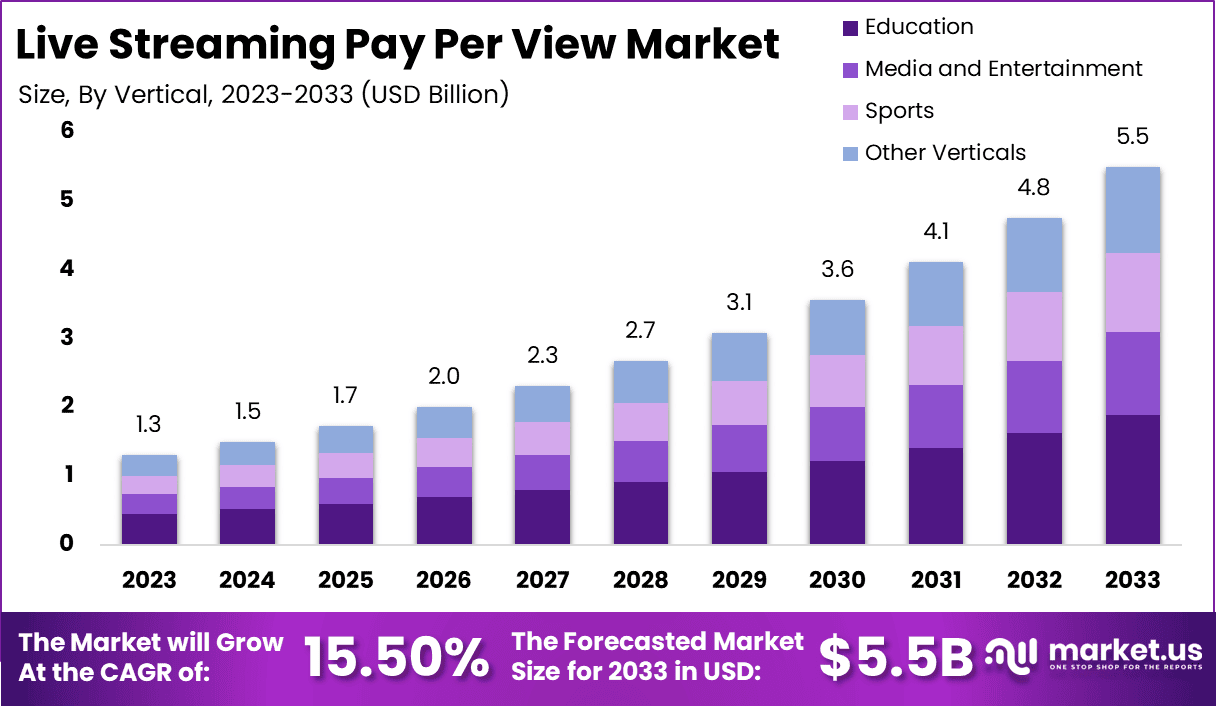
- The Live Streaming Pay Per View Market is a significant sub-segment, valued at approximately USD 45.28 billion in 2024, with projections suggesting a massive jump to USD 177.50 billion by 2035, indicating a robust CAGR of 22%.
- Within the broader VOD market segmentation by content type, the movies segment is specifically expected to record the highest Compound Annual Growth Rate (CAGR) over the forecast period.
- The North American region continues to dominate the global VOD market, commanding a significant share of 57% in 2024.
- Specific to the UK, the total value of the Digital Transactional market (TVoD in its traditional sense) remained stable at a value of £381 million in 2024, with a modest but consistent projected rise of 4% expected for 2025.
- Premium Video on Demand (PVOD) transactions, a higher-priced, early-access form of TVoD, delivered a total of £12.8 million in the UK in 2024 across approximately 807,000 transactions, with an average price point of £15.80 per unit.
Pay-per-View (TVoD) Market Size and Revenue Projections
 (Source: market.us)
According to Market.us, the trajectory of the Pay-per-View (TVoD) segment is characterized by rapid digital adoption and a willingness among consumers to pay a premium for timely, exclusive content, setting it on an aggressive growth path through the decade.
- The global VOD market, which encompasses TVoD, is anticipated to grow significantly from USD 127.4 billion in 2024 to an estimated USD 345.2 billion by 2033, signifying a strong cumulative growth projection of 13.1% CAGR.
- Focusing specifically on the Live Streaming Pay Per View sector, its market size is expected to reach USD 7.05 billion in 2025 and is forecasted to more than double to USD 20.41 billion by 2035, reflecting a healthy CAGR of 11.21% over the next eleven years.
- Revenue generated by the Sports segment within the Global Live Streaming Pay Per View Market is projected to hit $25.63 billion by 2024 alone, indicating a powerful CAGR of 14.5%.
- The Concerts segment within the live Pay Per View market is also a substantial contributor, with its 2024 revenue expected to reach $10.26 billion, growing at a slightly more moderate CAGR of 12.8%.
- Niche live content is expanding its footprint, with the Theatre segment projected to generate $4.51 billion in 2024, while the Conferences segment is expected to reach $3.84 billion.
- The Online Gaming segment is emerging as a high-growth area within live pay-per-view, with a projected revenue of $2.98 billion in 2024 and the highest growth forecast of 16.7% CAGR.
| Segment | Projected Revenue (2024/2025) | CAGR (Forecast Period) |
| Global VOD Market | USD 127.4 Billion (2024) |
13.1% (2025 to 2033) |
|
Live PPV Market |
USD 7.05 Billion (2025) | 11.21% (2025 to 2035) |
| Live PPV – Sports Segment | $25.63 Billion (2024) |
14.5% |
|
Live PPV – Concerts Segment |
$10.26 Billion (2024) | 12.8% |
| Live PPV – Online Gaming | $2.98 Billion (2024) |
16.7% (Highest CAGR) |
Global Pay-per-View (TVoD) Geographic Dominance
 (Source: market.us)
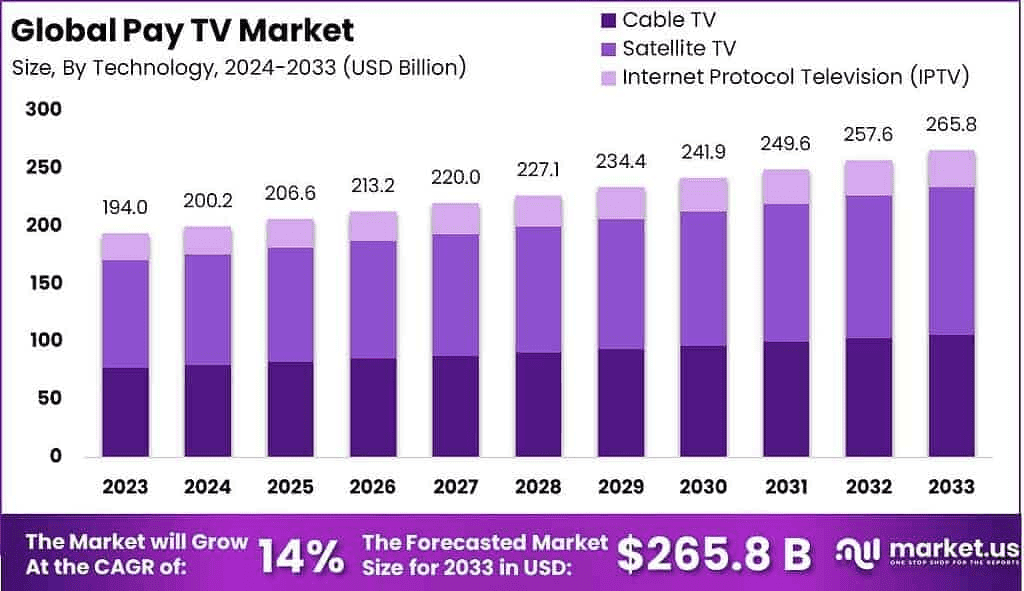
- North America is confirmed as the dominant region in the global VOD market, accounting for a commanding 38.57% market share in 2024.
- In terms of absolute revenue, the United States is projected to lead the world in TVoD revenue, with an estimated figure expected to reach USD 10,133.92 million in 2025.
- The United Kingdom secures the second position globally, with its total estimated TVoD revenue for 2025 forecasted to be around USD 5,823.16 million.
- Japan follows closely as the third largest market, with expected earnings from its Pay-per-View (TVoD) services projected to be approximately USD 5,423.40 million in 2025.
- Germany is forecasted to be a strong European contributor, generating an estimated USD 3,212.88 million from its digital transactional video services.
- Emerging markets are demonstrating explosive growth: the China Video-on-Demand Subscription Market is valued at USD 11.33 billion in 2024 but is projected to explode to USD 47.05 billion by 2034, with an incredibly high CAGR of 15.3%.
| Country/Region | Projected TVoD Revenue (2025) | Market Position |
| United States | USD 10,133.92 Million | 1st Global Market |
| United Kingdom | USD 5,823.16 Million | 2nd Global Market |
| Japan | USD 5,423.40 Million | 3rd Global Market |
| Germany | USD 3,212.88 Million | Top 4 Global Markets |
| China (VOD Market) | Projected to reach USD 47.05 billion by 2034 | Fastest Growth (15.3% CAGR) |
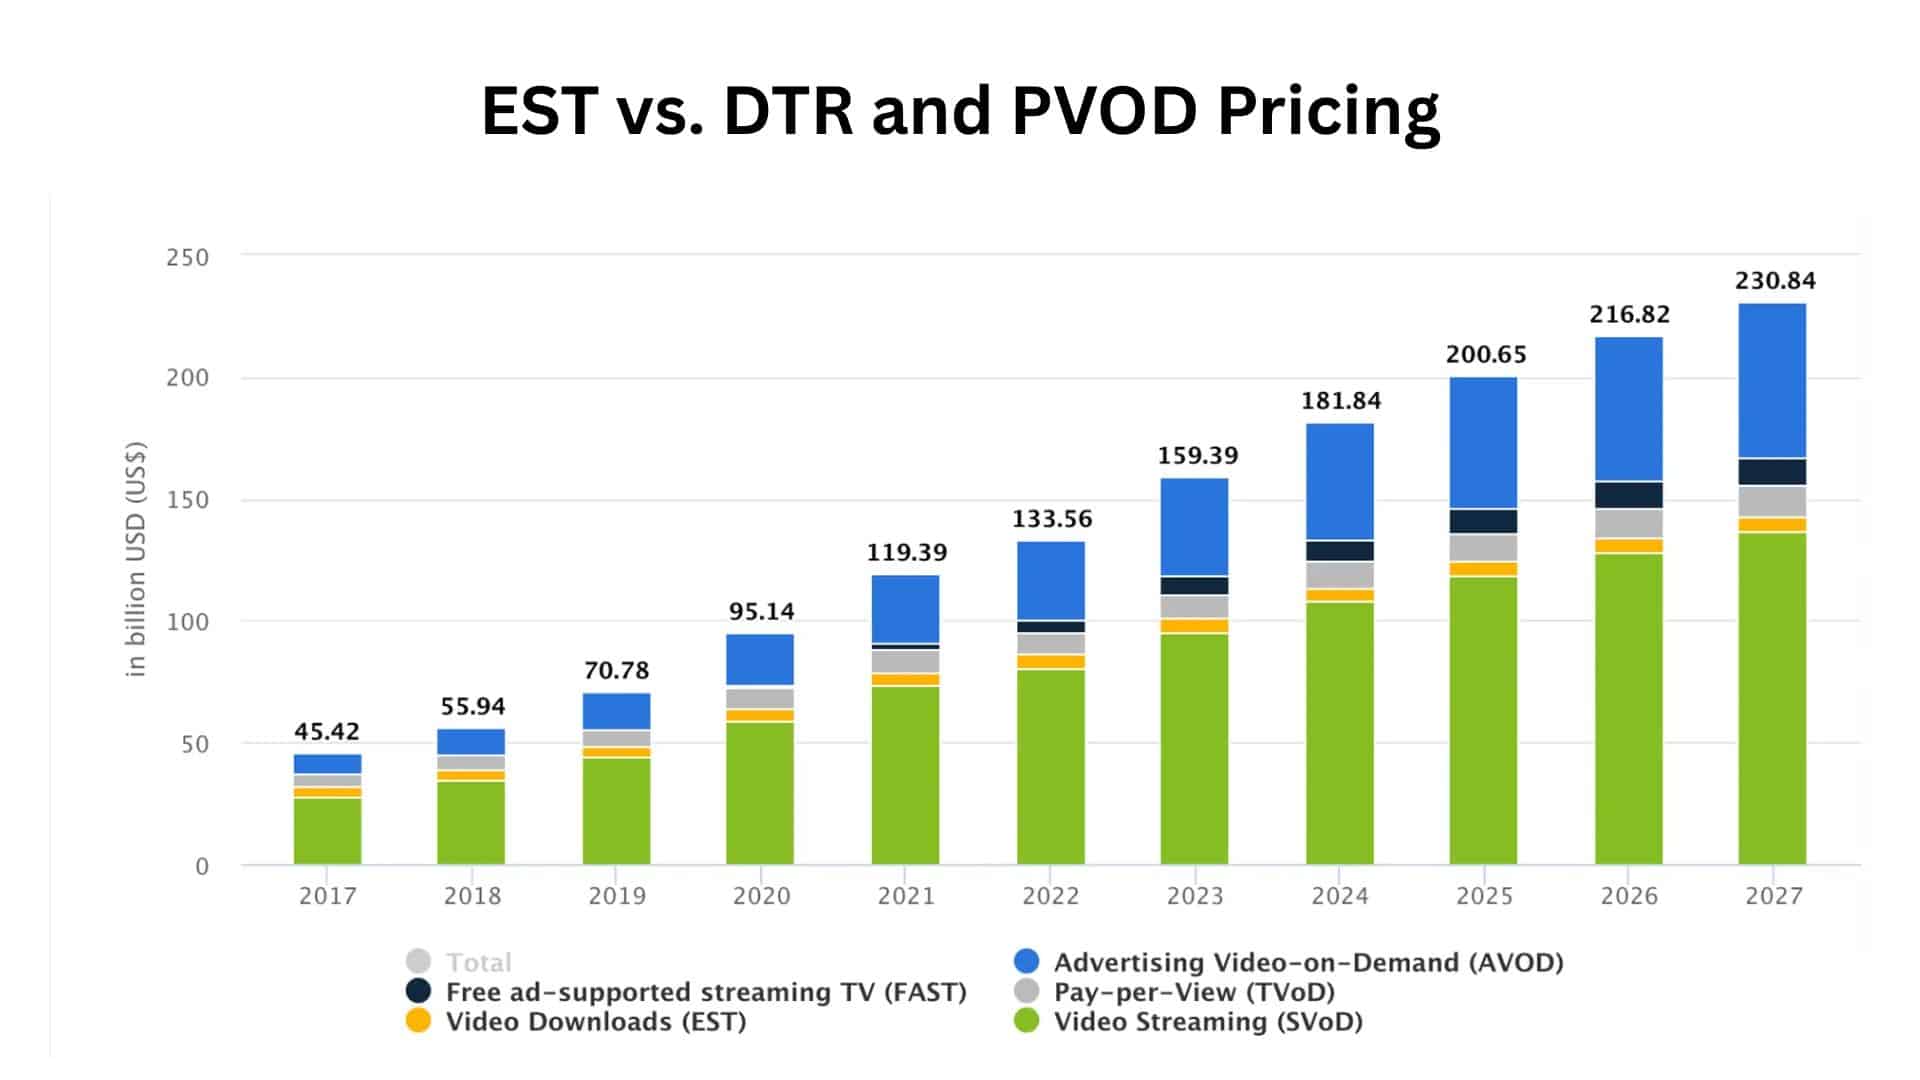
EST vs. DTR and PVOD Pricing
 (Source: simulmedia.com)
- The industry differentiates between Electronic Sell-Through (EST), which offers permanent access, and Download-to-Rent (DTR), which offers limited access, typically for a 48-hour window.
- Premium Video on Demand (PVOD), an accelerated form of TVoD, allows consumers to watch a film typically 40 days after its theatrical debut.
- The average consumer spending on a PVOD transaction in the UK in 2024 was recorded at a premium price of £15.80 per rental, showcasing a consumer willingness to pay over 3x the standard rental fee for new-release exclusivity.
- For a Premium Electronic Sell-Through (PEST) transaction, the average unit price was even higher, reaching approximately £19.60 per purchase in the UK, with the PEST window generating a total of £28.5 million from 1.5 million transactions in 2024.
- Major film franchises dominated the UK’s 2024 digital transactional charts, with titles like Oppenheimer topping the VOD rental chart and Deadpool & Wolverine securing the number one position for the Electronic Sell-Through (EST) segment.
- The biggest titles can drive massive TVoD sales: Oppenheimer sold an additional 713,000 units across all home video formats in 2024.
| TVoD Model | Typical Price Point (US/UK Equivalent) | Transaction Type |
| Download-to-Rent (DTR) | $4.99 to $6.99 (Lower Fee) | Limited-time rental (e.g., 48 hours) |
| Electronic Sell-Through (EST) | Up to $29.99 (Higher Fee) | Permanent Digital Ownership |
| Premium VOD (PVOD) | Average £15.80 (Premium Fee) | Early-access rental (Pre-standard TVoD) |
| Premium EST (PEST) | Average £19.60 (Highest Fee) | Early-access purchase |
Sports Pay-per-View (TVoD) Breakdown
 (Source: muvi.com)
- The UFC (Ultimate Fighting Championship), the dominant force in MMA, is a global phenomenon, with its events reaching over 900 million households on television across more than 170 countries.
- Historically, major boxing events have been the gold standard for PPV revenue, exemplified by the Mayweather vs. Pacquiao fight, which set a record with 4.4 million PPV buys and a gross revenue exceeding $400 million.
- MMA has rapidly closed the gap, with the Conor McGregor vs. Khabib Nurmagomedov fight generating a massive 2.4 million PPV buys and a total revenue of $180 million.
- Promoters often leverage price inelasticity in high-demand events: the Canelo Alvarez vs. Gennadiy Golovkin rematch saw a 200,000 decline in PPV buys (from 1.3M to 1.1M) but increased total revenue from $110 million to $120 million due to a price increase.
- While UFC maintains its Pay-per-View price point at a premium of $79.99 per event in the US, boxing events like Fury vs. Usyk were priced slightly lower at $69.99.
- The segment is shifting: the UFC is expected to fully exit the traditional Pay-per-View business soon after a massive 7-year, US$7.7 billion deal with a major content provider
| Combat Sport Event | Highest Recorded PPV Buys | Highest Recorded Revenue | PPV Price Point (2024/2025) |
| Boxing (Mayweather vs. Pacquiao) | 4.4 Million Buys | Over $400 Million | Varies, e.g., $69.99 (Fury vs. Usyk) |
| MMA (McGregor vs. Nurmagomedov) | 2.4 Million Buys | $180 Million | Typically $79.99 (UFC US Price) |
| Canelo vs. Golovkin II | 1.1 Million Buys | $120 Million | Price increase resulted in higher revenue despite lower buys. |
Pay-per-View (TVoD) Demographics and Consumer Behavior
 (Source: statista.com)
- The primary demographic actively purchasing Pay-per-View (TVoD) content is the 25 to 34 age group, which accounts for the single largest share of users at 21.5%.
- The second largest group of TVoD users falls within the 35 to 44 age bracket, making up a substantial 17.9% of the total user base.
- Young adults aged 18 to 24 years represent the third largest segment, constituting 15.7% of all users.
- In terms of gender distribution, the TVoD market shows a clear male skew, with 54.4% of all users identified as male, compared to 45.6% identified as female.
- Older demographics show a slower adoption rate for TVoD, with the 55 to 64 age group and the 65 and above group representing the smallest segments at 9.4% and 9.5% respectively.
- The average time spent watching video content at home in the UK reached 4 hours and 30 minutes per day in 2024.
| Age Group | Percentage of TVoD Users |
| 25 to 34 Years | 21.5% |
| 35 to 44 Years | 17.9% |
| 18 to 24 Years | 15.7% |
| 65 and Above | 9.5% |
| Gender | Percentage of TVoD Users |
| Male | 54.4% |
| Female | 45.6% |
Pay-per-View (TVoD) Distribution Channels
 (Reference: zype.com)
- Google TV, a major aggregator and distributor of TVoD content, boasts an estimated 270 million active monthly users, providing a colossal.
- Apple’s Services segment, which encompasses transactional storefronts like iTunes, is a massive financial engine expected to generate nearly USD 24.2 billion in revenue for the second quarter of 2025.
- In the traditional broadcast space, platforms like Sky Box Office remain relevant, with projections for the first half of 2025 suggesting a significant revenue generation of up to USD 385 million through its core Pay-per-View model.
- The ubiquitous adoption of mobile devices is key: the Smartphones segment is projected to dominate the VOD market in 2024, commanding more than 69.4% market share due to the high-speed mobile internet penetration, making in-app TVoD purchases on smartphones a primary consumer behavior.
- Broadcaster VOD (BVoD) consumption in the UK reached an average of 25 minutes per person per day in 2024, which, for the first time, was higher than the time spent on recorded playback of live channels (23 minutes).
- Hybrid models are the future: the emergence of services like Disney+’s Premier Access demonstrates a shift where a consumer pays a premium TVoD fee ($26 to $30) on top of an existing SVOD subscription.
| Platform/Metric | Key Statistic |
| Google TV | 270 Million Active Monthly Users |
| Apple Services (iTunes, etc.) | Projected USD 24.2 Billion in Q2 2025 Revenue |
| Smartphones Segment | Dominates VOD with over 69.4% Market Share |
| Sky Box Office (Traditional PPV) | Up to USD 385 Million Projected Revenue (H1 2025) |
Conclusion
Overall, these statistics confirm that Pay-per-View (TVoD) is a meticulously calculated, high-margin pillar of the modern entertainment economy. While Subscription Video on Demand (SVOD) focuses on building a massive recurring base, TVoD is dedicated to maximizing revenue from exclusivity of the content.
The global market growth, especially the CAGR of 15.3% projected for key regions like China, demonstrates that the demand for premium, one-time purchases is accelerating, not fading. Furthermore, the specialized and lucrative nature of live events, with the Sports segment $25.63 billion in 2024, ensures the continued relevance of the Pay-per-View format, particularly as major sports organizations change their most valuable content to digital transactional models.
As the core demographic of 25 to 34 year olds continues to mature, and with device penetration nearing 70% on smartphones, the infrastructure and consumer willingness to support premium, single-purchase content are stronger than ever. I hope you like this piece of content. If you found this useful, kindly share it with your friends. Thanks for staying up till the end.
