






Starter
Inventory Control Statistics: Imagine you’re running a shop, a warehouse, or even a huge e-commerce store. Your shelves are packed, orders are rolling in, and customers are expecting fast deliveries. Sounds exciting, right? But here’s the catch: if you don’t know exactly what’s in stock, what’s running low, and what’s just gathering dust, your business can lose money faster than you make it. That’s where inventory control comes in, and trust me, these inventory control statistics tell a story that every business owner should hear.
We’re not just talking about counting boxes or updating a spreadsheet. This is about smart planning, tracking, and avoiding costly mistakes that drain profits. So, put in a nutshell, from small corner shops to billion-dollar brands, the right inventory control system can mean the difference between smooth operations and complete problems. And when you see the data, you’ll understand why companies are investing millions in getting it right.
In this article, we’re going to explore the most eye-opening, complete research-based inventory control statistics that reveal the real impact of stock management on businesses worldwide. I’ll walk you through the numbers, the trends, and the effects so you can see why inventory control isn’t optional; it’s essential for survival in today’s competitive market. Let’s get into it.
The Elite Selection
- The concept of inventory control dates back thousands of years, but modern inventory control statistics began shaping in the early 20th century with the rise of mass production and supply chain models.
- Globally, poor inventory management costs businesses an estimated USD 1.1 trillion annually through overstocking, understocking, and losses.
- Around 34% of businesses have had to delay or cancel customer orders in the past year due to inaccurate inventory data.
- Companies using real-time inventory control systems experience a 25% reduction in storage costs and up to 30% faster order fulfillment.
- Retailers lose nearly USD 1.75 trillion every year due to stockouts and overstock situations combined.
- About 43% of small businesses don’t track their inventory or use a manual process, which leads to double the stock discrepancy rate compared to those with automated systems.
- Implementing a barcode or RFID tracking system improves inventory accuracy to 98 to 99%, compared to 63% for manual counting.
- The Just-in-Time inventory control approach can reduce inventory holding costs by up to 50%, especially in manufacturing sectors.
- In e-commerce, real-time inventory visibility increases customer satisfaction rates by up to 35% due to accurate product availability information.
- Warehouse automation linked to inventory control systems can improve picking accuracy by 9% and reduce operational costs by up to 40%.
| Statistic / Fact | Value / Data |
| Annual global loss due to poor inventory control | USD 1.1 trillion |
| Businesses are delaying/canceling orders due to errors | 34% |
| Cost reduction from real-time systems | 25% |
| Speed improvement in order fulfillment | 30% |
| Annual retail loss from stockouts/overstocks | USD 1.75 trillion |
| Small businesses without tracking systems | 43% |
| Inventory accuracy with RFID/barcode | 98 to 99% |
| Inventory accuracy with manual methods | 63% |
| Holding cost reduction with Just-in-Time | 50% |
| Customer satisfaction boost with real-time visibility | 35% |
| Picking accuracy with warehouse automation | 99.9% |
| Operational cost reduction from automation | 40% |
Origins of Inventory Control Statistics
(Source: cashflowinventory.com)
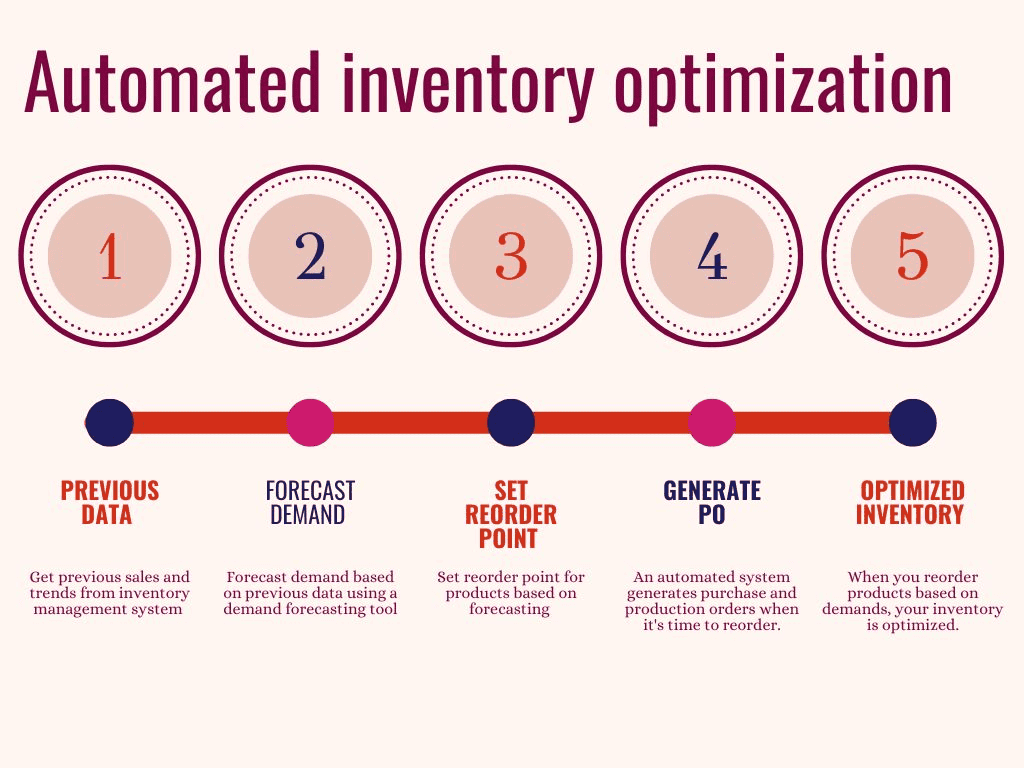
- EOQ (Economic Order Quantity), developed in 1913, remains a foundation for balancing ordering and holding costs.
- ABC analysis uses Pareto’s idea, roughly 20% of SKUs make up 80% of value, so control those tightly.
- JIT (Just-In-Time) by Toyota trimmed inventory 30 to 50% when supplier reliability and changeover times improved.
| Concept | Year | Core Idea | Impact |
| EOQ | 1913 | Balance ordering vs holding cost | Still drives reorder logic |
| ABC analysis | 1900s | Focus on the high-value 20% of SKUs | Efficient oversight |
| JIT | 1950s | Sync production to demand, reduce stock | Inventory cut by 30 to 50% |
Macro Inventory to Sales Ratio
(Source: macromicro.me)
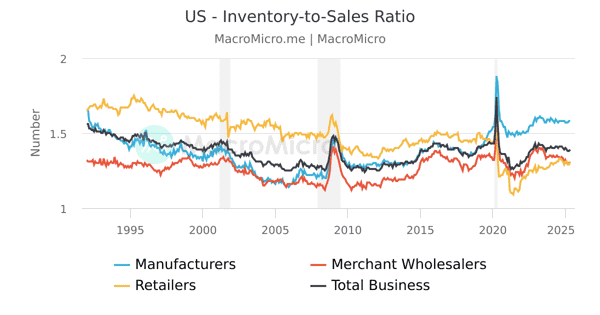
- As of March 2025, the U.S. maintained 1.34 months in inventory-to-sales ratio steady for the past year, suggesting stable post-pandemic conditions.
| Metric | Value | Context |
| U.S. ratio (Mar 2025) | 1.34 months | Benchmark of balanced inventory levels |
Carrying Cost of Inventory
(Source: eturns.com)
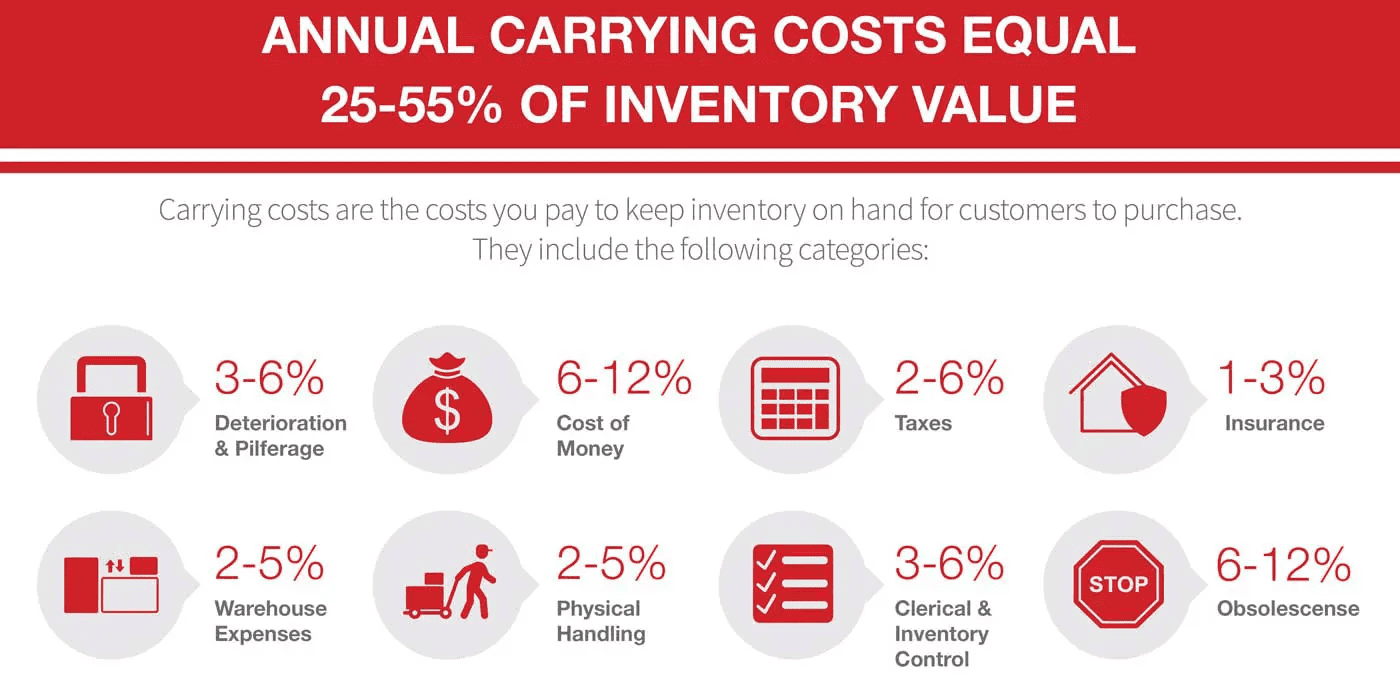
- Typical annual carrying cost: 20 to 30% of average inventory value, which includes financing, storage, risk, shrinkage, and obsolescence.
- Changes in interest rates from 2023 to 2025 likely shifted the capital-cost portion update quarterly.
| Area | Percent of Inventory | Notes |
| Carrying cost total | 20 to 30% | Full cost of holding inventory |
| Capital cost portion | Variable | Moves with interest rates |
| Review cadence | Quarterly | Keeps EOQ/reorder targets aligned |
Inventory Accuracy and Shrink
(Source: abcsupplychain.com)
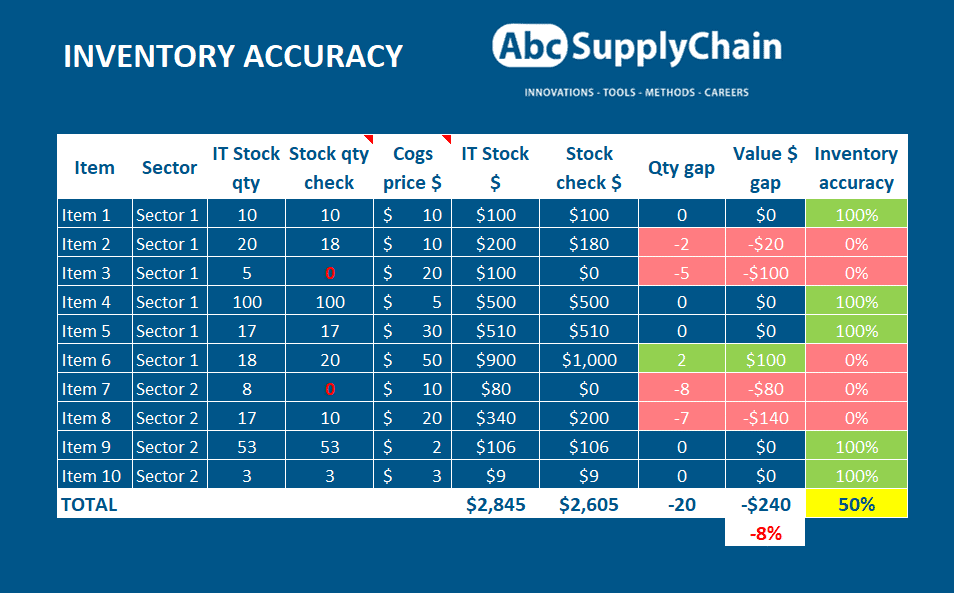
- Retail avg inventory accuracy: around 63 to 65%; barcode systems struggle. Best setups achieve 97 to 99% with strong tech and process.
- Shrink in retail: approx 1.6% of sales, translating into a serious margin hit.
- Warehouse shrink drivers: employee theft 40%, administrative errors 25%, vendor/system errors 20 to 28%. RFID can shrink up to 50%.
| Metric | Value/Range | Significance |
| Inventory accuracy (avg) | 63 to 65% | Poor system trust |
| Inventory accuracy (top) | 97 to 99% | Requires strong discipline and tech |
| Retail shrink rate | 1.6% of sales | Direct drain on margins |
| Warehouse shrink causes | 40% theft, 20 to 28% errors | Target areas for loss reduction |
| RFID shrink reduction | up to 50% | Big improvement potential |
Stockouts and Fill Rate
(Source: linkedin.com)
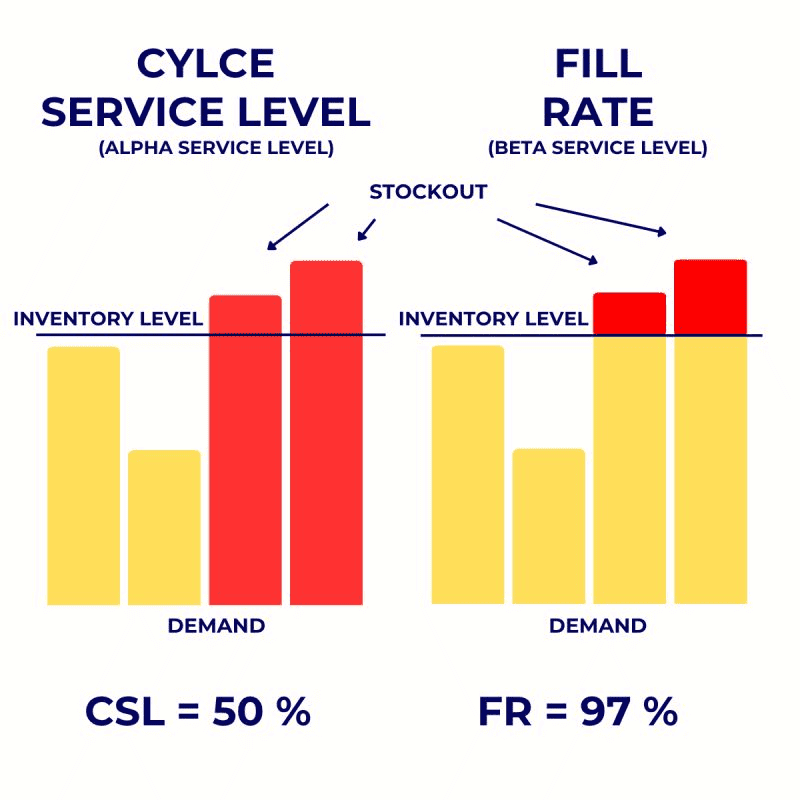
- Retail stockout losses: retailers lose around USD 224 billion annually; per company, it’s about USD 2.1 million.
- Typical fill rate: 92 to 93%; top performers exceed 95%.
- Out-of-stock leads to 4% sales loss and can shift brand loyalty.
| Metric | Typical Value | Business Effect |
| Retail stockout loss | USD 224B total / USD 2.1M per company | Lost sales, customer trust erosion |
| Fill rate | 92 to 93% | Good baseline; 95% is elite service |
| Sales loss from OOS | 4% | Customers permanently shift |
Forecast Accuracy and Advanced Methods
(Source: netsuite.com)
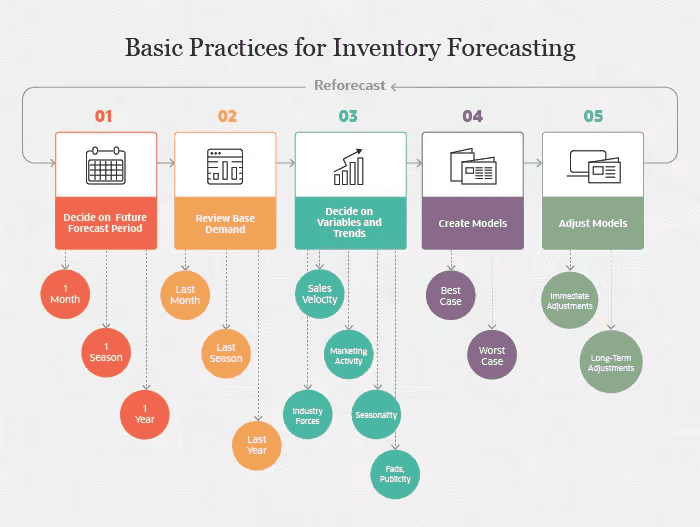
- Only 35% of businesses feel confident about their forecast accuracy; inventory errors cause 3 to 10% lost sales annually.
- Data-driven approaches, time series, random forests, and deep reinforcement learning are being tested in supermarkets for improved forecasting and cost control.
- Unreliable data leads to 70% of supply chain delays.
| Indicator | Value/Context | Impact |
| Confidence in forecast accuracy | 35% | Too many companies fly blind |
| Sales lost to inventory errors | 3 to 10% | Tangible revenue loss |
| Advanced forecasting methods | AI/ML bis eing trialled | Potential boost in responsiveness |
Safety Stock and Optimization
(Source: anylogistix.com)
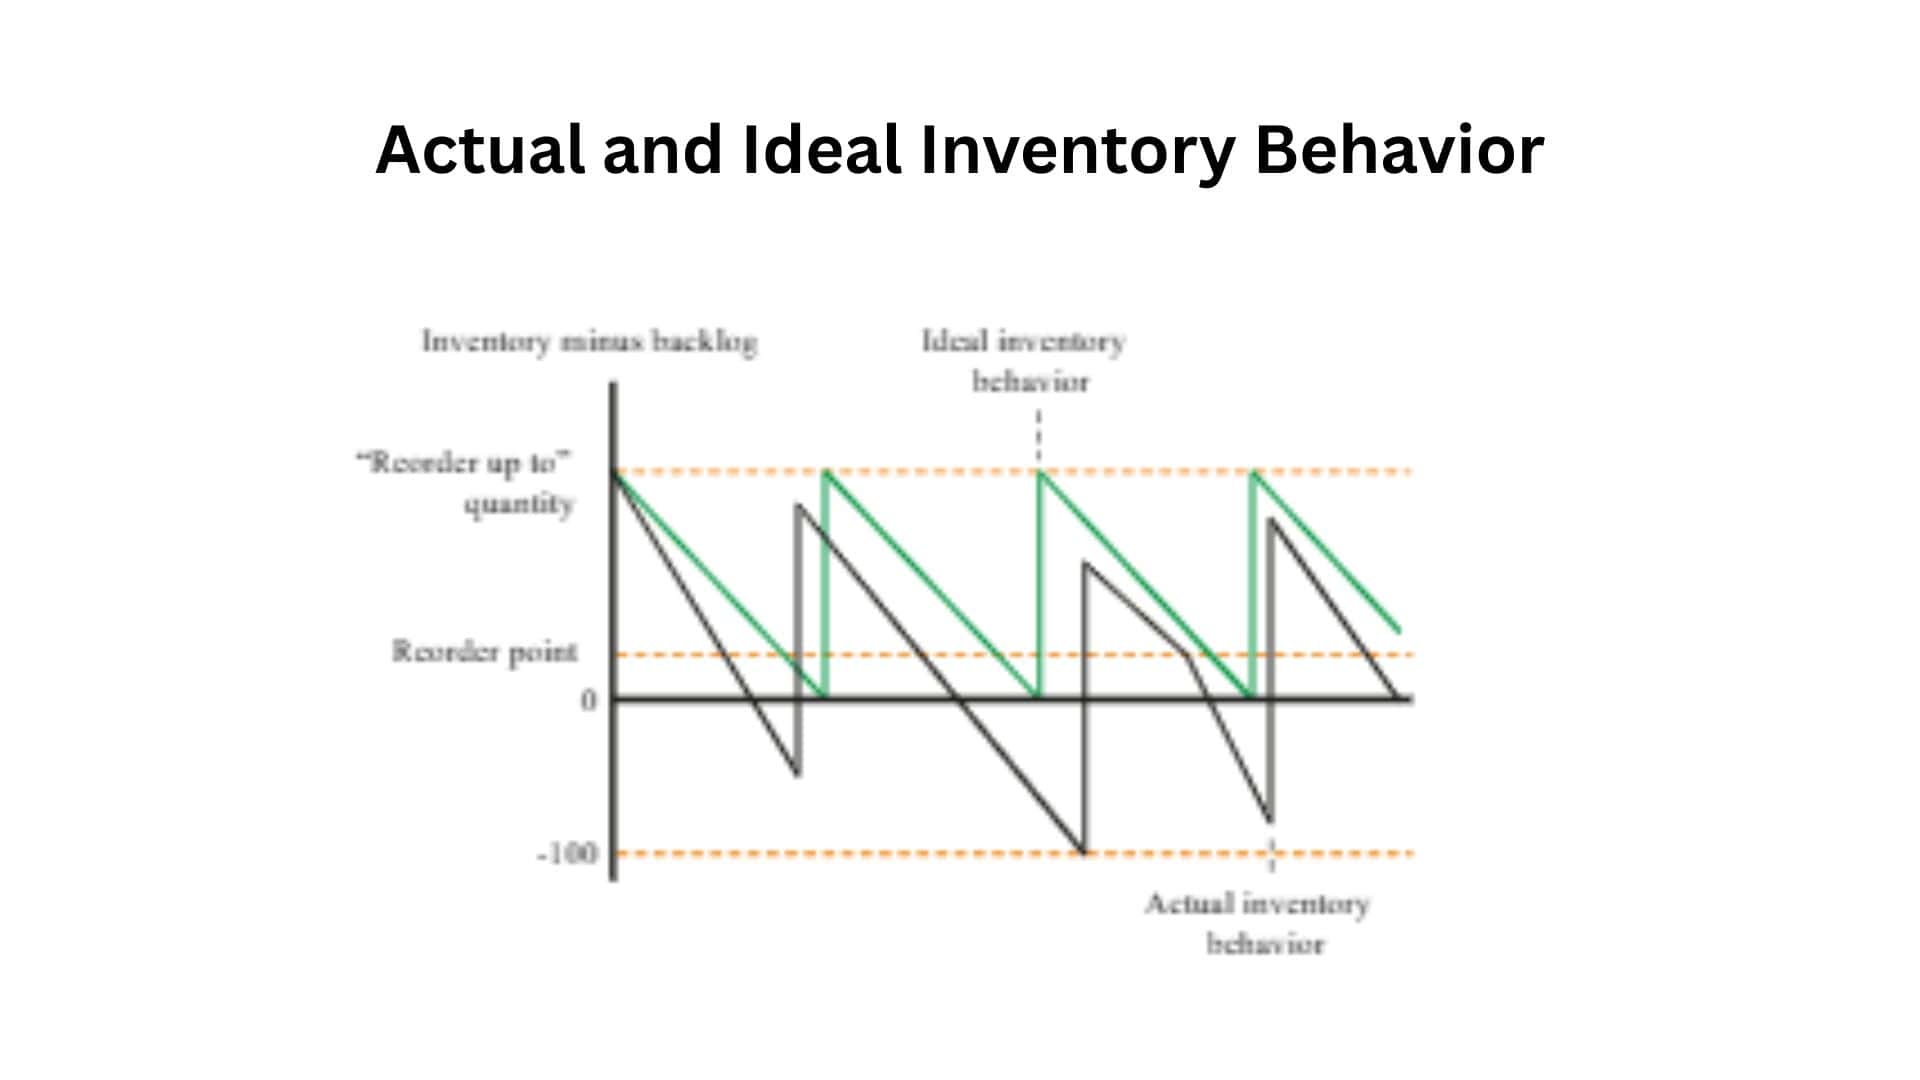
- Inventory optimization engines have helped organizations reduce inventory by up to 25% in a year and boost discounted cash flow by 50% in under two years.
- JIT systems can cut inventory by up to 40%, but require precise forecasting.
| Strategy | Inventory Reduction | Benefit |
| Inventory optimization tools | up to 25% | Lower working capital, improved ROI |
| JIT implementation | up to 40% | Lean stock requires high forecasting accuracy |
Cycle Counting and Phantom Inventory
(Source: relexsolutions.com)
- Only 63% of companies regularly cycle count.
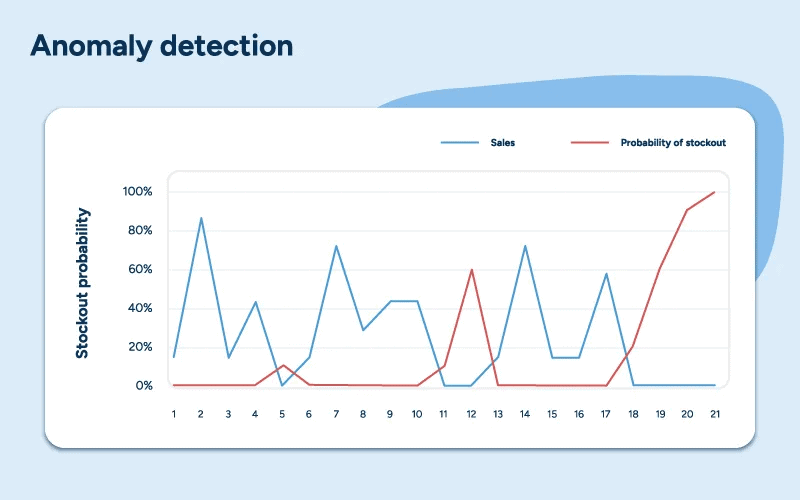
- Phantom inventory items listed as available but missing physically cause missed orders, inaccurate forecasting, and revenue misses. RFID, audits, and modelling tackle it.
- Effective audits can lift sales by 11% in grocery stores, particularly where stock listings exceed actual inventory.
| Issue | Impact | Mitigation |
| Regular cycle counting | 63% of companies perform it | Should be universal |
| Phantom inventory effects | Missed sales, distorted forecasts | Use RFID and audits to correct |
| Sales lift from audits | 11% in grocery cases | Audits pay in ROI |
Tech- AI, RFID, and Market Trends
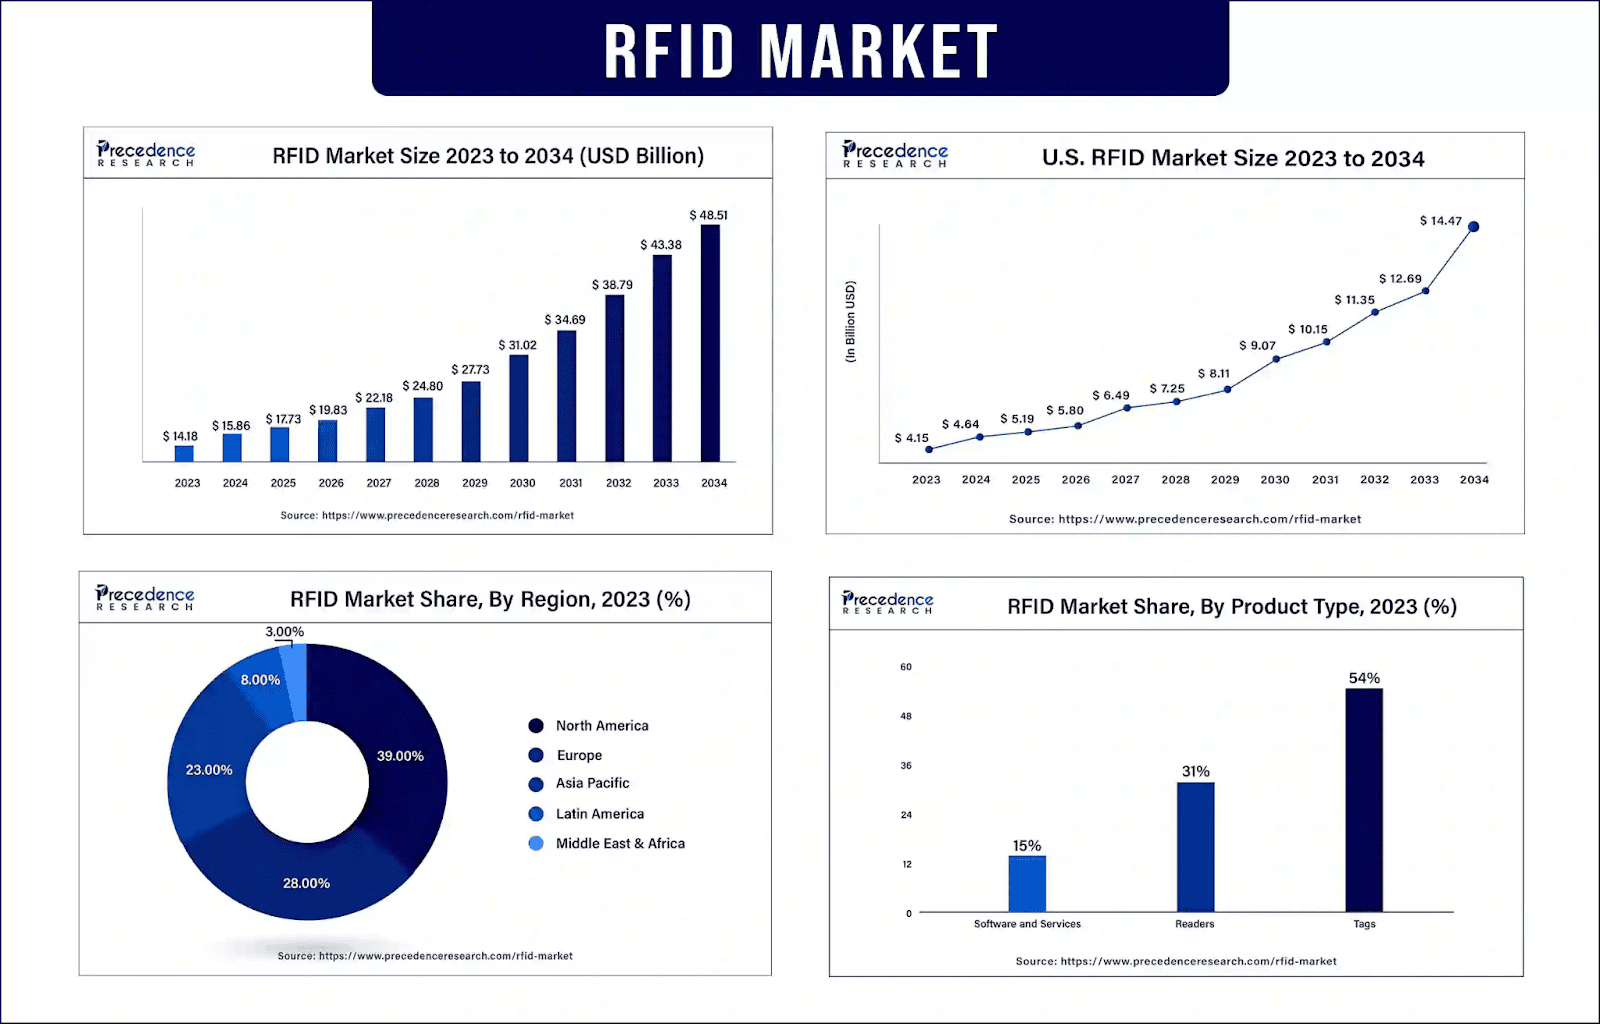
(Source: precedenceresearch.com)
- Retailers like Target, Walmart, and Home Depot are using AI to predict shortages, misplacements, and proactively manage inventory. Target doubled coverage to 40% of SKUs in 2 years. Walmart tailors’ inventory to regional needs.
- AI supply chain tools spending is expected to jump from USD 2.7B to USD 55B by 2029.
- Automated systems reduce stockouts by up to 80%, excess inventory by 25%, and inventory holding costs by 10 to 15%.
- AI and automation adoption are climbing: 90% of companies plan more automation, 30% plan AI in the next 3 years, and machine-learning use is set to grow 50% in 5 years.
| Technology | Benefit/Stat | Trend |
| AI inventory systems | Proactive shortage prevention | Used by Target, Walmart, and Home Depot |
| AI spending projection | USD 2.7B USD 55B (by 2029) | Massive industry growth |
| Automated systems impact | 80% fewer stockouts; 25% less excess | Clear efficiency and cost benefit |
| Future adoption | 90% plan automation; 50%+ ML growth | Rapid movement toward high-tech inventory |
AI Automation in Inventory Management
- 46% of SMBs have already implemented inventory management software which allows them to automate their process of managing inventory and improving the accuracy of this process.
- Organizations that use automatic inventory management system face fewer cases of stockouts since their stock is always being monitored in real-time and kept at the right level.
- Automating your inventory allows you to achieve up to 50% increase in efficiency due to the reduction of manual work.
- 78% of eCommerce businesses are going to implement automated inventory management by 2025.
Market and Macro Insights
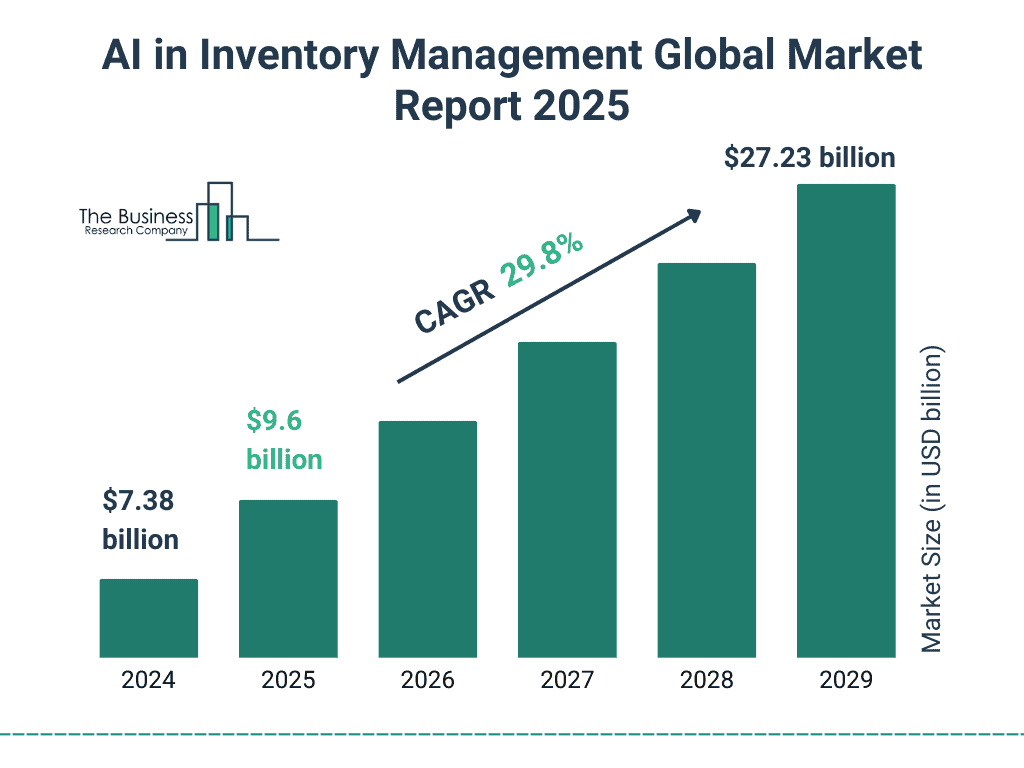
(Source: thebusinessresearchcompany.com)
- Global inventory management software market: worth USD 10.6B (2021); projected to grow at a CAGR of 6.4% (2022 to 2028); RFID tracking market growth, and automation tools are surging.
- Mistakes in inventory data erode up to USD 1.1 trillion a year.
- Automated systems slash labor cost by 20 to 30%, reduce excess stock by 25%, and elevate return on inventory tech investment (USD 4.50 saved per USD 1 spent).
| Metric | Value/Estimation | Business Insight |
| Market size (software) | USD 10.6B | Growing industry importance |
| Annual losses from data errors | USD 1.1T | Huge opportunity in fixing accuracy |
| ROI on inventory tech | USD 4.50 saved per USD 1 spent | Clear financial rationale |
| Labor cost savings | 20 to 30% reduction | Automation trade-offs |
Final Thoughts
In general, as you analyze the figures provided here, it becomes evident that inventory control is an integral factor in earning profits, increasing client satisfaction and achieving business growth. Inventory control facts provided above demonstrate how effective management of stocks saves money, eliminates waste and ensures quick responses to changing market demands.
In today’s competitive environment, one cannot afford to overlook this data. I hope you enjoyed this article. Should you have any questions or comments, please let me know in
the comments section below.
FAQ
Inventory control is the process of tracking stock levels, managing storage, and regulating the flow of goods. Key aspects include maintaining optimal quantities, preventing overstock or shortages, and reducing holding costs.
Key performance indicators (KPIs) in inventory management are metrics that help you monitor and make decisions about your stock.
A good inventory accuracy percentage is 97% or higher, with world-class and highly automated operations targeting 99% to 99.5%. Anything dropping below 95% creates a high risk for stockouts and order errors.

Sources