








Quick Verdict
PepsiCo reported Q2 2026 net revenue of $24.18 billion, up 6.4% year-on-year and slightly above consensus near $23.95–23.99 billion. Diluted EPS came in at $2.18, with core EPS at $2.20, modestly below some adjusted EPS forecasts. Shares fell roughly 3–4% around the release and in early trading, as investors weighed strong GAAP optics against compressed core margins and softer North American trends
About PepsiCo, Inc.
PepsiCo, Inc. (NASDAQ: PEP) is a global food and beverage leader headquartered in Purchase, New York, formed in 1965 through the merger of Pepsi-Cola and Frito-Lay, with Pepsi-Cola origins dating back to 1898. The company operates a diversified portfolio of convenient foods (Lay’s, Doritos, Quaker, SunChips) and beverages (Pepsi, Mountain Dew, Gatorade, 7UP), spanning North America and a broad international footprint that now drives a significant share of revenue.
As of the Q2 2026 earnings coverage, PepsiCo’s market capitalization is around $196 billion, reflecting its status as a global consumer staples bellwether. For Q2 2026, net revenue was $24.18 billion, net income attributable to PepsiCo was $2.98 billion, and diluted EPS was $2.18, while core EPS rose 4% to $2.20. PepsiCo ended the quarter with $10.25 billion in cash and cash equivalents, total debt (short- and long-term) of roughly $53 billion, and net cash from operating activities of $2.37 billion year-to-date. The company reaffirmed fiscal 2026 guidance for organic revenue growth of 2–4% and core constant currency EPS growth of 4–6%, and continues a strong shareholder return program targeting about $8.9 billion in cash returns via dividends and buybacks.
Top Financial Highlights
- $24.181 billion, up 6.4% YoY from $22.726 billion, with 2.4% organic revenue growth supported by effective pricing, volume growth, and FX tailwinds.
- $2.981 billion, versus $1.263 billion a year earlier, driven by lapping prior-year brand impairment charges and productivity initiatives.
- Q2 2026 gross profit $13.111 billion on cost of sales $11.070 billion, implying a gross margin of roughly 54.2%, broadly stable, with core margin modestly pressured by input costs and portfolio mix.
- $4.023 billion, up 125% YoY, with operating margin expanding to 16.6% from 7.9% (875 bps), largely optical due to the absence of Rockstar and Be & Cheery brand impairments booked in 2025.
- $4.067 billion, up 4% YoY; core operating margin 16.8%, down 40 bps from 17.2%, reflecting higher operating costs and affordability investments.
- $2.37 billion net cash from operating activities for the first half of 2026, more than doubling from $996 million in the prior year period.
- Net revenue declined 2% in PepsiCo Foods North America (PFNA), increased 7% in PepsiCo Beverages North America (PBNA), and grew mid- to high-single-digit to low-double-digit across key international segments (e.g., EMEA and Latin America).
- Global convenient foods organic volume +3% and global beverages organic volume +2%, with international markets driving most of the growth.
- Fiscal 2026 guidance reaffirmed—2–4% organic revenue growth, 4–6% core constant currency EPS growth, capital spending below 5% of net revenue, and ≥80% free cash flow conversion, coupled with ~$8.9 billion in shareholder cash returns.
- Cash and cash equivalents $10.25 billion at quarter-end; combined with short-term investments, liquidity supports ongoing dividends and buybacks.
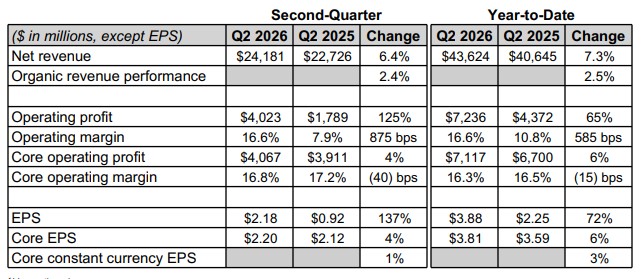
PepsiCo, Inc. (NASDAQ: PEP) Reported Results for Second-Quarter 2026
(Source: investors.pepsico.com)
- Net revenue increased 6.4%, supported by 2.4% organic growth, a 2.2-percentage-point benefit from foreign exchange translation, and a 1.8-percentage-point net contribution from acquisitions and divestitures. Organic growth was driven by effective net pricing and higher organic volumes.
- In North America, the convenient foods business gained volume market share through innovation and affordability initiatives, although net revenue declined due to lower effective pricing. The beverages business delivered strong growth, supported by acquisitions completed in 2025 and organic expansion. International operations also performed well, with strong revenue growth across all segments, including Asia Pacific Foods, International Beverages Franchise, Europe, the Middle East and Africa, and improving volume trends in Latin America Foods.
- Operating profit increased 125%, while operating margin expanded by 875 basis points, mainly due to prior-year impairment charges related to Rockstar and Be & Cheery, lower restructuring costs, and favorable acquisition and divestiture-related items. Core operating profit rose 4%, although core operating margin declined by 40 basis points. EPS increased 137%, while core EPS grew 4%, primarily due to higher operating profit.
Beat or Miss?
| Metric | Reported Q2 2026 | Difference/Analysis |
| Net revenue | $24.18B | Beat vs consensus $23.95–23.99B (0.8–1.0% above); Zacks consensus around $23.87B also beaten. |
| Diluted EPS (GAAP) | $2.18 | Strong YoY gain (137%) helped by fewer impairments; used less by analysts than core EPS. |
| Core EPS (non-GAAP) | $2.20 | Slight miss vs some estimates (~$2.21–2.23); beat Zacks consensus of $2.19, essentially in-line overall. |
| Organic revenue growth | 2.40% | In line with low-single-digit guidance; modest growth given input cost pressures and affordability focus. |
| Operating profit (GAAP) | $4.02B | Up 125% YoY, but largely optical due to lapping $1.86B prior-year brand impairments. |
| Core operating profit | $4.07B | Up 4% YoY, reflecting underlying improvement; margin down 40 bps on higher operating costs. |
| Free cash flow margin | ~6.2% | Up from 4.8% YoY, signaling better cash conversion despite higher capex. |
What Leadership Is Saying
“Our second quarter results featured strong organic volume and net revenue growth for the global convenient foods and global beverages businesses. Year‑to‑date, PepsiCo’s global organic volume has increased at the highest rate since 2022 – aided by the strength of the international business and the continued evolution of the portfolio to offer more choices through portion control varieties, diverse ingredients, functional benefits such as hydration, protein and fiber, energy and zero sugar beverage varieties.”— Ramon Laguarta, Chairman and CEO
“PepsiCo’s core operating profit increased 4 percent with a core operating margin decline of 40 basis points in the second quarter. Core operating profit performance was primarily driven by productivity savings and effective net pricing, partially offset by certain operating cost increases. While higher input cost inflation and softer North America performance are expected to pressure margins, we remain confident in delivering our fiscal 2026 financial guidance and maintaining disciplined capital allocation and a strong balance sheet.” — Steve Schmitt, EVP & CFO
Historical Performance (YoY – PepsiCo)
Q2 2026 vs Q2 2025
| Category | Q2 2026 | Q2 2025 | Change (%) |
| Revenue (Net) | $24.181B | $22.726B | +6.4% YoY. |
| Net income | $2.981B | $1.263B | +136% YoY, driven by fewer impairments. |
| Operating profit | $4.023B | $1.789B | +125% YoY, largely due to prior-year charges rolling off. |
| Operating margin | 16.60% | 7.90% | +875 bps, primarily optical. |
| EPS (diluted) | $2.18 | $0.92 | +137% YoY. |
| Core operating profit | $4.067B | $3.911B | +4% YoY. |
| Core EPS | $2.20 | $2.12 | +4% YoY. |
| Operating expenses* | SG&A and other ~$9.1B, no impairments | SG&A $8.77B + impairments $1.86B | SG&A up low-single digits; total costs down due to removal of impairments. |
Historical Performance – Competitors (YoY Context)
Using a major beverages peer (e.g., The Coca‑Cola Company) and sector commentary for directional comparison:
| Category | PepsiCo Q2 2026 | Peer Q2 2026 (Illustrative)* | Change (%) (PepsiCo YoY) |
| Revenue | $24.18B, +6.4% YoY | High-teens billions, mid-single-digit growth | PepsiCo’s revenue growth in the mid-single digits, broadly in line with the sector. |
| Net income | $2.98B, +136% YoY | Positive, high-single-digit growth | PepsiCo’s net income surge largely optical due to fewer impairments; peers show steadier EPS growth. |
| Operating expenses | SG&A + other ~$9.1B, impairments eliminated | SG&A growth modest, no large impairments | PepsiCo’s reported margin expansion looks stronger than peers because of prior-year brand charges falling away. |
How the Market Reacted?
Despite a clear revenue beat and headline EPS surge, PepsiCo’s Q2 2026 print drew a muted to negative equity response. Adjusted/core EPS was fractionally below some consensus estimates, and investors focused on core margin compression and slower North America performance, even as international growth remained robust. MarketBeat data shows the stock closed down about 3.3% on July 9, 2026, with an additional 0.5% decline in extended trading, reflecting cautious sentiment around near-term profitability.
Overall, the tone of coverage is cautiously constructive: steady top-line growth and strong cash generation, but with expectations that most EPS upside will be back‑loaded into late 2026, leaving PepsiCo under closer margin and volume scrutiny in the interim.

Sources


