








Quick Verdict
Novavax reported a Q2 2026 GAAP loss of $0.32 per share on $56.7 million in revenue, exceeding consensus estimates of a $0.36 loss and $52.5 million in revenue. Shares closed 0.5% higher on August 6 and indicated a further 0.8% pre-market gain.
About Novavax
Novavax, Inc. (Nasdaq: NVAX) is a Gaithersburg, Maryland-based biotechnology company founded in 1987. It develops vaccine technologies centered on protein-based nanoparticles and its Matrix-M adjuvant, while increasingly monetizing these capabilities through partnerships rather than direct commercial infrastructure. Its marketed and partnered assets include Nuvaxovid, the COVID-19 vaccine, and R21/Matrix-M; the company is also advancing a C. difficile vaccine candidate and seeking Matrix-M applications in infectious disease and oncology.
At the latest available market snapshot, Novavax had a market capitalization of approximately $1.27 billion, a share price of $7.74, a trailing P/E of -5.09, and no dividend yield. The company reported 749 employees, although management has outlined plans for a materially leaner cost base through 2028.
Top Financial Highlights
- Total revenue was $56.7 million, down 76% year over year from $239.2 million.
- GAAP net loss was $53.4 million, compared with net income of $106.5 million in Q2 2025.
- Basic and diluted GAAP EPS were both -$0.32, versus $0.66 basic EPS and $0.62 diluted EPS a year earlier.
- Revenue exceeded the $52.5 million consensus estimate by approximately $4.2 million, or 8.0%.
- EPS beat the -$0.36 consensus forecast by $0.04 per share.
- Product sales increased 76% to $18.9 million, led by Matrix-M demand and supply sales to license partners.
- Supply sales rose 47% to $19 million; Nuvaxovid sales recorded directly by Novavax were $0 million.
- Sanofi-related revenue was $36 million, down from $199 million, reflecting the absence of a large prior-year milestone.
- Licensing, royalties and other revenue totaled $37.8 million, down from $228.5 million.
- Gross profit was $42.5 million; the implied consolidated gross margin was 74.9% on $56.7 million of revenue and $14.2 million of cost of sales.
- R&D expense declined 11% to $70.7 million, while SG&A fell 39% to $26.7 million.
- Non-GAAP combined R&D and SG&A expense fell 36% to $74.8 million.
- Net cash used in operating activities was $72.8 million for the six months ended June 30, 2026; this is a year-to-date cash-flow figure, not a Q2-only measure.
- Cash, cash equivalents, marketable securities and restricted cash totaled $724 million at June 30, versus $751 million at year-end 2025.
- Full-year adjusted revenue framework was raised to $235 million–$275 million, while GAAP combined R&D and SG&A guidance improved to $370 million–$410 million. No standalone Q3 revenue or EPS guidance was issued.
Second Quarter 2026 Total Revenue
(Source: ir.novavax.com)
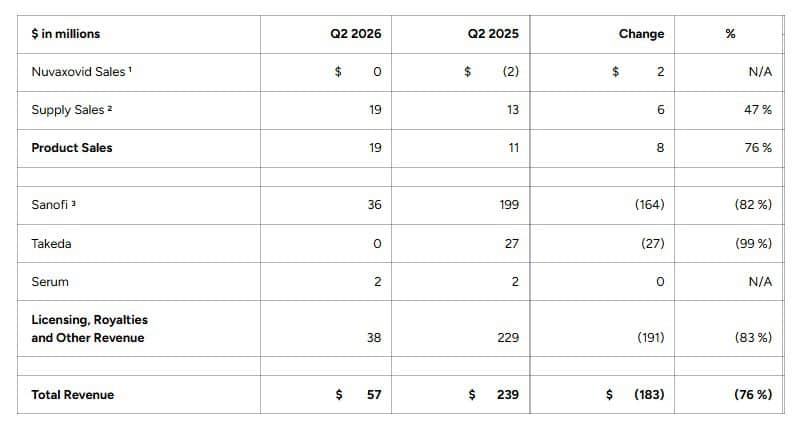
- The table highlights a significant contraction in second-quarter revenue, with total revenue falling 76% YoY to $57 million in Q2 2026, from $239 million in Q2 2025. The decline was primarily driven by a sharp reduction in licensing, royalties, and other revenue rather than weakness in product-related sales.
- Product sales improved to $19 million, up 76% from $11 million a year earlier. Supply sales were the main contributor, increasing 47% to $19 million from $13 million. Nuvaxovid sales were effectively $0 million, compared with a negative $2 million adjustment in Q2 2025. This indicates better product-level performance, although the absolute revenue contribution remains relatively small.
- The major pressure came from Licensing, Royalties and Other Revenue, which declined 83% to $38 million from $229 million. Revenue associated with Sanofi dropped 82% to $36 million from $199 million, accounting for most of the overall revenue decrease. Takeda revenue also fell to $0 million from $27 million, a decline of approximately 99%, while Serum revenue remained stable at $2 million.
- From a financial perspective, the quarter shows a major shift in revenue composition. Product sales are becoming a larger proportion of total revenue, but this improvement was not sufficient to offset the $191 million decline in licensing and partnership-related revenue. The key issue for future quarters will therefore be whether stronger product and supply sales can provide a more sustainable recurring revenue base as large collaboration-related payments decline.
Beat or Miss?
| Metric | Reported | Difference/Analysis |
| Revenue | $56.7 million | Beat consensus of $52.5 million by $4.2 million (about 8.0%) |
| GAAP EPS | ($0.32) | Better than consensus loss of -$0.36 by $0.04 |
| Product sales | $18.9 million | Increased 76% year over year, driven by Matrix-M and license-partner supply demand |
| Full-year adjusted revenue framework | $235M–$275M | Raised from $230M–$270M; midpoint increased $5 million |
| Q3 revenue/EPS outlook | N/A | Novavax provided full-year framework rather than quarter-specific guidance |
Consensus comparisons are based on earnings-history data available immediately after the release.
What Leadership Is Saying
“In 2025, we set out to build a different kind of biotechnology company, one powered by partnering our technology, targeted and capital-efficient innovation, and a lean and agile operating model.” — John C. Jacobs, President and CEO
“Today, we are also improving our full-year 2026 combined GAAP R&D and SG&A expense guidance. At midpoint, we expect to achieve results of $390 million, a $10 million reduction and improvement to our prior guidance.” — Jim Kelly, CFO
Historical Performance
| Category | Q2 2026 | Q2 2025 | Change (%) |
| Revenue | $56.7 million | $239.2 million | -76.30% |
| Net income (loss) | -$53.4 million | $106.5 million | NM—shifted to loss |
| R&D expense | $70.7 million | $79.2 million | -10.80% |
| SG&A expense | $26.7 million | $43.6 million | -38.90% |
| Combined R&D and SG&A | $97.4 million | $122.8 million | –20.70% |
The revenue comparison is distorted by a $175 million U.S. BLA-approval milestone and a $27 million Takeda amendment recognized in Q2 2025. Excluding this $202 million item, the year-over-year decline principally reflects the absence of one-time partner revenue, while product sales and operating costs improved.
Competitor Historical Performance
Moderna is used as a publicly traded vaccine-focused peer; it is not a like-for-like comparison because its product portfolio, R&D scale and revenue base differ substantially from Novavax’s. Moderna is among the peer companies identified for NVAX.
| Category — Moderna (MRNA) | Q2 2026 | Q2 2025 | Change (%) |
| Revenue | $145 million | $142 million | 2.10% |
| Net loss | -$782 million | -$825 million | 5.2% lower loss |
| R&D expense | $651 million | $700 million | -7.00% |
| R&D and SG&A combined | $867 million | $930 million | -6.80% |
Novavax’s revenue is materially smaller, but its Q2 product-sales growth and sharper reduction in non-GAAP operating expenses underscore its transition toward a lower-fixed-cost partnership model. Moderna’s Q2 revenue was broadly flat year over year while it remained in a substantially larger R&D investment cycle.
How the Market Reacted?
NVAX closed at $7.74 on August 6, up $0.04, or 0.52%, following the earnings release. The stock’s one-day post-earnings move was approximately +0.52%, a muted response relative to its historically high expected earnings volatility. In pre-market trading on August 7, shares were quoted at $7.80, up another 0.75% from the regular-session close.
The market response appears cautiously constructive: investors received revenue and EPS beats, higher full-year revenue framework guidance and further cost-control progress, but the reported revenue decline and continued net loss remain material risks.

Sources


