








Quick Verdict
The BP p.l.c. Q2 2026 Earnings report demonstrated strong performance, as BP delivered Q2 2026 underlying EPS of $2.22 per ADS and sales and other operating revenue of $69.1 billion, surpassing consensus expectations. Underlying replacement-cost profit reached $5.7 billion, while BP shares rose roughly 0.8% in early London trading after the August 4 release.
About BP p.l.c.
BP p.l.c. (NYSE: BP; LSE: BP.) is a London-headquartered, integrated global energy company founded in 1908. Its activities span oil and natural-gas exploration and production, LNG, refining, fuel marketing, lubricants, trading and shipping, and selected lower-carbon businesses. Major consumer and commercial brands include bp, Castrol, Aral, ARCO and am/pm. The company operates across upstream and downstream value chains, allowing its global trading organization to optimize crude, refined-product and gas flows during market disruptions.
As of August 10, BP’s U.S.-listed ADRs were priced at $42.88, implying a market capitalization of approximately $112.5 billion, a trailing P/E ratio of 20.99, and a trailing dividend yield of about 5.0%. BP employed approximately 93,700 people as of 2025. The company’s Q2 results marked CEO Meg O’Neill’s first full quarter in the role and placed balance-sheet repair, portfolio simplification and operational reliability at the center of its strategy.
Top Financial Highlights
- Sales and other operating revenues rose 48.2% year over year to $69.1 billion; reported total revenue and other income was approximately $70.1 billion.
- IFRS profit attributable to BP shareholders increased 140.1% to $3.9 billion, from $1.6 billion in Q2 2025.
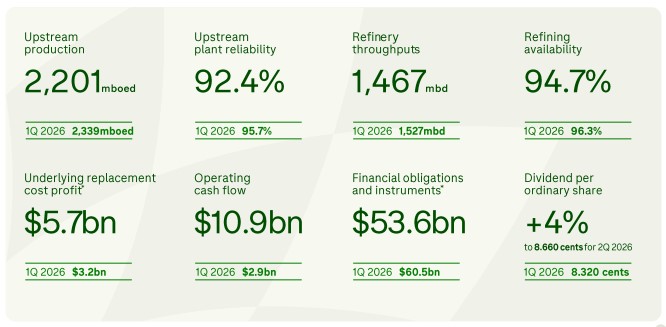
- Underlying replacement-cost (RC) profit, BP’s primary adjusted earnings metric, reached $5.7 billion, up from $2.4 billion a year earlier and $3.2 billion in Q1 2026.
- Underlying RC profit per ADS was $2.22, compared with $0.90 in Q2 2025.
- Operating cash flow rose 73.1% to $10.9 billion, despite a $1.0 billion adjusted working-capital build.
- Gross margin was not separately disclosed in the earnings release; for integrated energy companies, reported gross margin is less comparable than segment RC profit and cash flow.
- Gas & low-carbon energy underlying RC profit before interest and tax was $2.1 billion, up from $1.5 billion in Q2 2025.
- Oil production & operations underlying RC profit before interest and tax was $3.6 billion, versus $2.3 billion a year earlier.
- Customers & products underlying RC profit before interest and tax rose to $5.0 billion, from $1.5 billion, supported by stronger refining margins, customer volumes, Castrol and oil trading.
- Upstream production was 2.201 million barrels of oil equivalent per day, down from 2.300 million a year earlier; upstream plant reliability was 92.4%, below both Q1 2026 and Q2 2025.
- Net debt fell to $22.3 billion at quarter-end, versus $25.3 billion at the end of Q1 2026 and $26.0 billion a year earlier. BP did not separately report quarter-end cash on hand in its headline release.
- Capital expenditure was $3.1 billion in Q2, bringing first-half capex to $6.4 billion.
- The quarterly dividend increased 4% to 8.66 cents per ordinary share.
- For Q3, BP guided to reported upstream production of 2.100–2.250 million boe/d and refining throughput of 1.300–1.360 million barrels/day.
- Full-year 2026 capex guidance was set at $13.5–$14.0 billion, while divestment and other proceeds are expected at $8–$9 billion.
2Q 2026 highlights
(Source: bp.com)
2Q 2026 Cash Flow and Balance Sheet
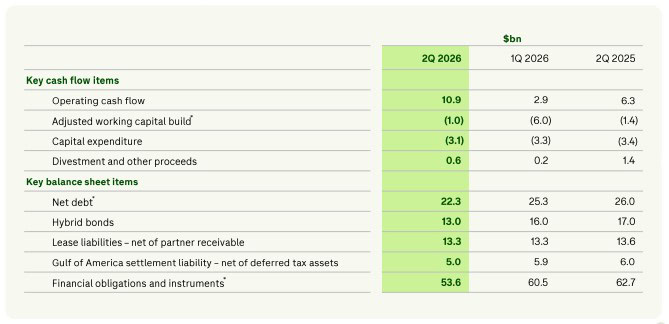
- The image highlights a clear improvement in the company’s cash flow generation and balance sheet position in Q2 2026, compared with both Q1 2026 and Q2 2025.
- Operating cash flow increased significantly to USD 10.9 billion in Q2 2026, compared with USD 2.9 billion in Q1 2026 and USD 6.3 billion in Q2 2025. This improvement was supported by stronger underlying cash generation, despite an adjusted working capital outflow of USD 1.0 billion and capital expenditure of USD 3.1 billion. Divestment and other proceeds contributed USD 0.6 billion, compared with USD 0.2 billion in the previous quarter.
- The balance sheet also strengthened during the period. Net debt declined to USD 22.3 billion from USD 25.3 billion in Q1 2026 and USD 26.0 billion in Q2 2025. Hybrid bonds decreased to USD 13.0 billion, compared with USD 16.0 billion and USD 17.0 billion, respectively. Lease liabilities remained stable at USD 13.3 billion, while the Gulf of America settlement liability declined to USD 5.0 billion.
- Overall financial obligations and instruments fell to USD 53.6 billion in Q2 2026, down from USD 60.5 billion in Q1 2026 and USD 62.7 billion in Q2 2025. The data indicates stronger liquidity, improving cash conversion, and a continued reduction in financial leverage.
(Source: bp.com)
Beat or Miss?
| Metric | Reported | Difference/Analysis |
| Underlying RC profit | $5.73 billion | Beat the LSEG consensus of $5.0 billion by approximately $0.73 billion, or 14.6%. |
| Underlying EPS per ADS | $2.22 | Beat the $1.87 consensus published by MarketBeat by $0.35. |
| Revenue / operating revenue | $69.11 billion | Above the $57.89 billion estimate shown by MarketBeat by $11.22 billion. |
| Operating cash flow | $10.86 billion | No consensus figure identified; cash conversion strengthened sharply despite the working-capital build. |
| Net debt | $22.25 billion | Down approximately $3.06 billion sequentially, supporting balance-sheet repair. |
What Leadership Is Saying
“Every dollar of capital has to compete, and we need to get fit to grow. We need to compete in the weight class we are in, focusing capital on our best opportunities to maximize cash flow and returns.” — Meg O’Neill, Chief Executive Officer
“This quarter, stronger earnings converted into stronger cash generation, helping us to reduce financial obligations by around $7 billion.” — Kate Thomson, Chief Financial Officer
Historical Performance
| Category | Q2 2026 | Q2 2025 | Change (%) |
| Sales and other operating revenues | $69.11 billion | $46.63 billion | 48.20% |
| Profit attributable to BP shareholders | $3.91 billion | $1.63 billion | 140.10% |
| Underlying RC profit | $5.73 billion | $2.35 billion | 143.60% |
| Operating cash flow | $10.86 billion | $6.27 billion | 73.10% |
| Underlying operating expenditure | $5.33 billion | $5.46 billion | -2.30% |
BP’s year-over-year earnings expansion principally reflected higher liquids realizations, materially stronger realized refining margins and a significantly higher oil-trading contribution. Reported production, however, declined 4.3% year over year, while upstream reliability also weakened.
Competitor Historical Performance
Chevron is used as the peer comparison because it is a directly comparable global integrated oil major that reported Q2 results in the same commodity-price environment. This is directional rather than fully like-for-like because reporting conventions and business mix differ.
| Category | Chevron Q2 2026 | Chevron Q2 2025 | Change (%) |
| Total revenues and other income | $70.06 billion | $44.82 billion | 56.30% |
| Net income | $12.1 billion | $2.5 billion | 384.00% |
| Operating expenses | $8.86 billion | $7.65 billion | 15.90% |
Chevron’s Q2 earnings uplift was even sharper than BP’s, with higher commodity prices and refining margins driving its reported net income to $12.1 billion. Its revenue base was broadly similar to BP’s reported total revenue and other income, but its earnings were substantially larger.
How the Market Reacted?
The immediate reaction was positive but measured: BP shares traded about 0.8% higher in London on the morning of the announcement, with investors responding to the profit beat, improved cash generation, lower net debt and a 4% dividend increase. The reception was tempered by weaker production, lower refinery throughput and management’s acknowledgment that operational reliability and cost performance remain below the required standard. As of the latest available U.S. market snapshot on August 10, BP ADRs closed at $42.88, up 3.0% on the day, with pre-market trading indicated at $43.29

Sources


