





Opening Remarks
Paramount Statistics: Paramount is one of the world’s largest entertainment companies, creating popular movies, TV shows, and streaming content for millions of viewers. From blockbuster films to live sports and hit television series, the company has built a strong presence across traditional and digital media. As streaming continues to grow, Paramount is expanding its content library, increasing subscribers, and strengthening its global reach. Its financial performance, advertising business, and well-known brands also play a key role in its success.
This article covers the latest Paramount statistics, including revenue, streaming subscribers, market share, business performance, content, and other important facts that highlight the company’s growth and position in the global entertainment industry.
Standout Choices
- Paramount Skydance raised 2026 adjusted EBITDA guidance to USD 3.8-3.9 billion while maintaining its USD 30 billion revenue outlook.
- Q2 2026 revenue reached USD 6.91 billion, with adjusted EBITDA rising 27% YoY to USD 1.1 billion.
- Paramount+ grew to 81.6 million subscribers after adding 2 million users in Q2 2026.
- Direct-to-Consumer revenue increased 9% YoY to USD 2.47 billion.
- Studios revenue climbed 16% to USD 1.31 billion due to stronger film content performance.
- The company targets over USD 3 billion in merger synergies and USD 2.7 billion in annual run-rate efficiencies by year-end 2026.
- Paramount+ ad revenue per viewer increased to USD 10.1 in 2026.
- Q2 2026 free cash flow reached USD 101 million, with free cash flow conversion guidance raised to at least 10% of adjusted EBITDA.
- UFC rights expansion and live sports content are expected to accelerate Paramount+ engagement and subscriber growth.
- Key risks include declining TV Media revenue, higher content amortization, and potential Warner Bros. Discovery deal costs.
Paramount’s Stock Performance and Corporate Overview
- Paramount reported Q2 2026 adjusted EBITDA of USD 1.1 billion, up 27% YoY.
- After the earnings release, the stock fell 5.37% to USD 16.91, compared with its 52-week range of USD 16.70-USD 23.89.
- The Skydance Media acquisition closed on August 7, 2025, and the company presented its June quarter 2026 results on August 4, 2026.
- Paramount now reports through 3 business segments: Studios, Direct-to-Consumer, and TV Media.
Financial Highlights
- According to a report published by aa.com.tr estimated that Paramount Skydance raised its full-year 2026 adjusted EBITDA guidance to USD 3.8-3.9 billion.
- The company maintained its USD 30 billion revenue outlook, representing around 4% annual growth.
- Q2 2026 revenue reached USD 6.91 billion, slightly above the USD 6.88 billion market estimate.
- Net earnings declined to USD 41 million, or USD 0.04 per share, from USD 57 million, or USD 0.08 per share, last year.
- Direct-to-consumer revenue increased 9% year over year to USD 2.47 billion.
- Paramount+ added 2 million subscribers, lifting its global subscriber base to 81.6 million.
- Film studio revenue grew 16% to USD 1.31 billion, supported by stronger content performance.
- TV media revenue fell 9% to USD 3.13 billion because of continued weakness in traditional pay-TV.
- Streaming growth and merger-related cost savings helped offset pressure in the legacy TV business.
- For Q3 2026, the company expects revenue between USD 6.95 billion and USD 7.15 billion, while Paramount+ subscriber additions are expected to remain broadly stable.
Segment Performance and Guidance
- According to Investing.com, Paramount+ ended Q2 2026 with 81.6 million subscribers, up from 77.8 million, after adding about 2 million subscribers during the quarter.
- The Direct-to-Consumer segment generated USD 4.872 billion in revenue during the first six months of 2026.
- DTC adjusted EBITDA reached USD 617 million in the first half of 2026, reflecting improved profitability.
- TV Media reported USD 2.118 billion in adjusted EBITDA, making it Paramount’s most profitable business segment.
- Paramount raised its full-year 2026 adjusted EBITDA guidance to USD 3.8-3.9 billion while maintaining its USD 30 billion revenue outlook.
- For Q3 2026, the company expects revenue between USD 6.95 billion and USD 7.15 billion and adjusted EBITDA of USD 875-975 million.
- As of June 30, 2026, Paramount reported net debt of USD 13.529 billion, total debt of USD 15.156 billion, and cash and cash equivalents of USD 1.627 billion.
- Q2 2026 free cash flow totaled USD 101 million, and the company increased its free cash flow conversion target to at least 10% of adjusted EBITDA.
- Paramount expects more than USD 3 billion in merger synergies and over USD 2.7 billion in run-rate efficiencies by the end of 2026.
- The merger has received regulatory approvals in 65 countries, while Paramount+ has 81.6 million subscribers, compared with Netflix‘s approximately 280 million subscribers.
Paramount Skydance Direct-to-Consumer Advertising Revenue Trends
- Statista reported that Paramount Skydance’s direct-to-consumer advertising revenue declined from USD 2,114 million in 2024 to USD 1,999 million in 2025.
- The company recorded a USD 115 million decline, representing a 5.4% year-over-year decrease in advertising revenue.
Paramount+ App Revenue Shows Steady Growth
- Paramount+ app revenue increased from USD 44.3 million in Q1 2025 to USD 46.2 million in Q2 2025.
- Revenue continued to grow, reaching USD 48.7 million in Q3 2025 and USD 51.6 million in Q4 2025.
- The upward trend continued in 2026, with revenue rising to USD 54.8 million in Q1 and USD 58.1 million in Q2.
Paramount+ Ad Revenue Trend
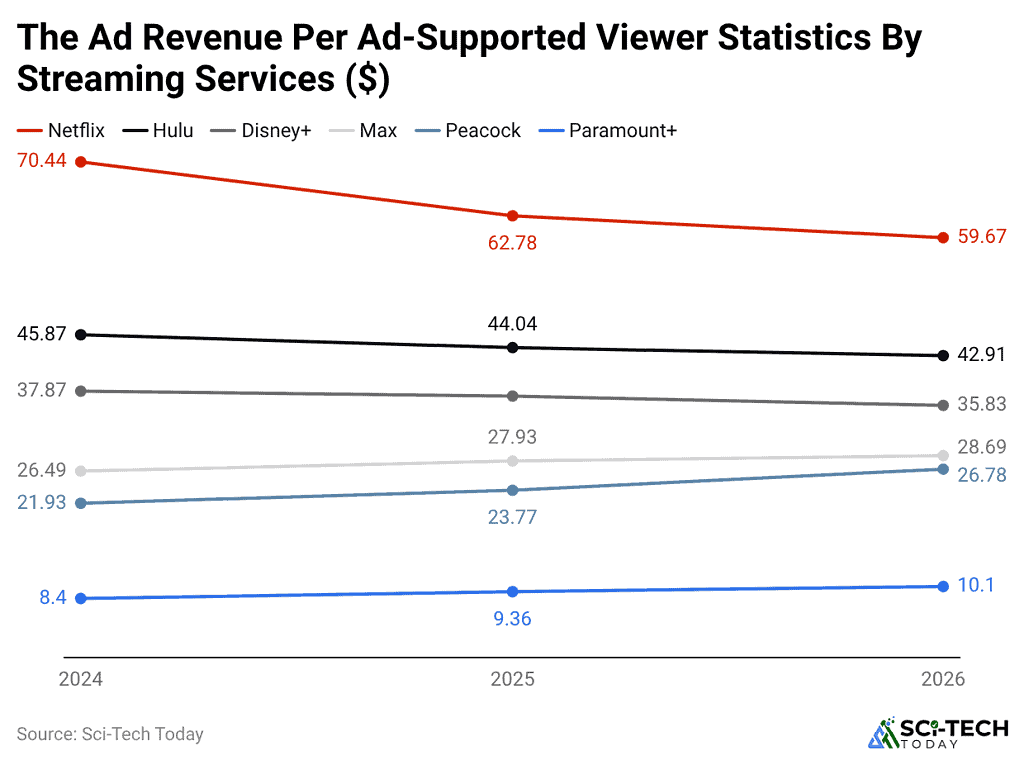
(Reference: eMarketer.com)
- Paramount+ ad revenue per ad-supported viewer rises from USD 8.4 in 2024 to USD 9.36 in 2025 and USD 10.1 in 2026.
- This is a steady gain of about 11% from 2024 to 2025 and around 8% from 2025 to 2026.
Global SVOD Platform Market Share
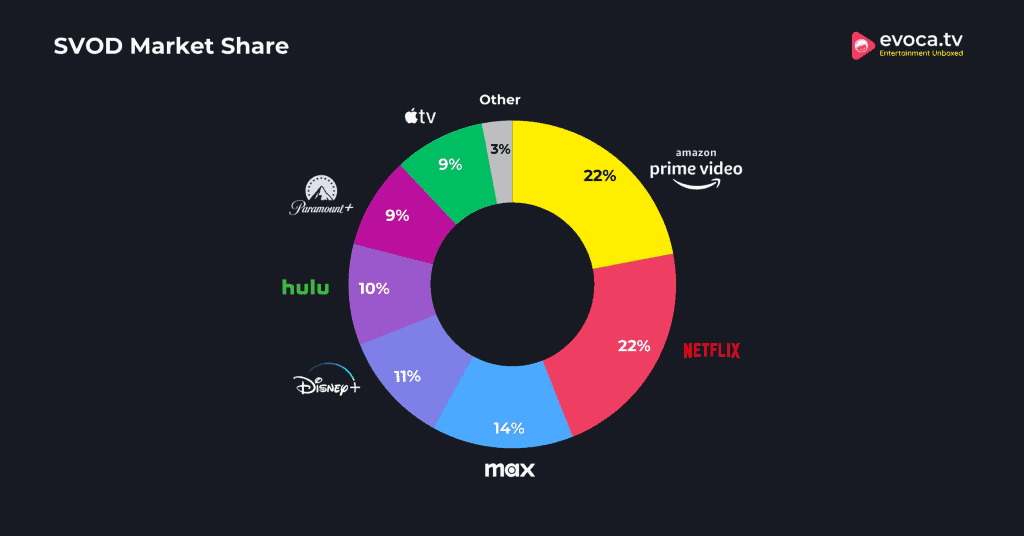
(Source: evoca.tv)
- Amazon Prime Video and Netflix jointly lead the SVOD market with a 22% share each.
- Max holds 14%, followed by Disney+ at 11% and Hulu at 10%.
- All other streaming platforms collectively account for the remaining 3% of the market.
- Paramount+ and Apple TV+ each account for 9% of the market.
Paramount+ Subscriber Growth
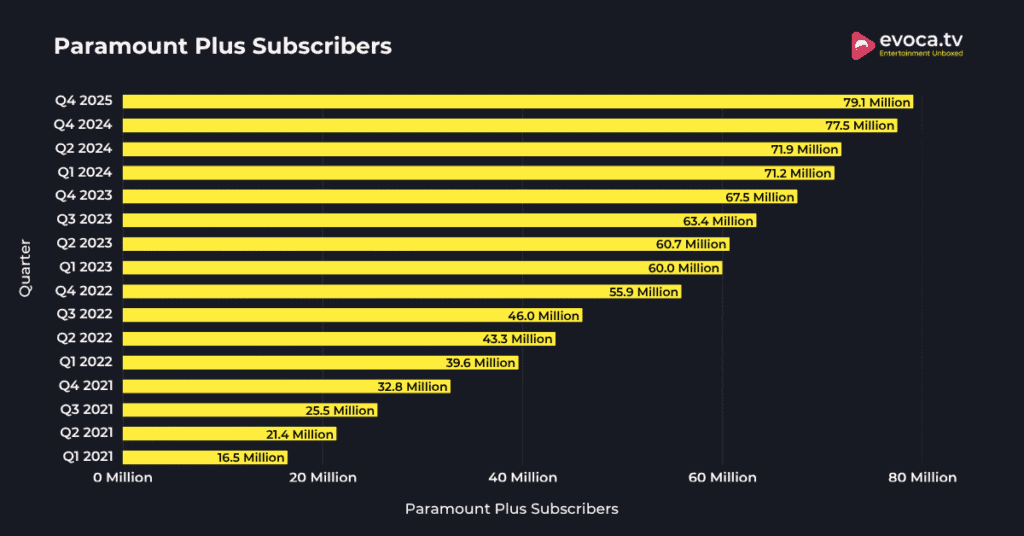
(Source: evoca.tv)
- According to evoca.tv, Paramount+ ended Q4 2025 with 79.1 million subscribers and projected 78.9 million by the end of 2025.
- 63% of Paramount+ users subscribe to ad-free plans.
- Around 3.1 million households in the United Kingdom have a Paramount+ subscription.
- Paramount+ holds 9% of the global SVOD market.
- Paramount+ revenue increased 16% in Q4.
- The platform offered 3,606 content titles.
- Paramount+ recorded 58.73 million visits in February 2026.
- Businessstats reports an estimate of 83.8 million subscribers in Q3 2026, while 82.5 million users were reported on June 1, 2026.
- Global subscribers increased by 1.8 million, representing 2% year-over-year growth in Q1 2026.
- Users watched 10.4 billion hours of Paramount+ content, while Pluto TV reached 89.6 million monthly active users, highlighting strong viewer engagement.
Paramount+ Subscribers and Plans, 2026
| Plan type | Monthly price (USD) | Annual price (USD) | Implied annual cost if paid monthly (USD) | Notes / relevant 2026 metrics |
| Premium Plan (Ad‑Free, with Showtime) | 13.99 per month | 139.99 per year | 167.88 (13.99 × 12) | Ad‑free on‑demand, includes Showtime library, live local CBS, 4K UHD, offline downloads; no free trial as of Jan 15, 2026. |
| Essential Plan (Ad‑Supported) | 8.99 per month | 89.99 per year | 107.88 (8.99 × 12) | Ad‑supported, core library, live sports (NFL on CBS, UCL), up to 3 devices; included free with Walmart+ ($12.95/mo or $98/yr). |
| Bundle Plan (with Showtime-marketed as Premium) | 13.99 per month | 139.99 per year | 167.88 (13.99 × 12) | This is effectively the Premium tier “Paramount+ with Showtime”; same pricing and benefits as Premium. |
| Annual Plans (all tiers, 2026 price points) | – | 89.99, 139.99 (Paramount+ only) | 107.88, 167.88 (monthly equivalents) | Business Insider notes annual plans offer “about 17% savings” compared with 12 months of monthly billing in 2026. |
Paramount Workforce Overview and Hiring Trends
- Reveliolabs report further stated that Paramount had 18,151 employees globally in March 2026, compared with 17,725 employees in 2025, reflecting a workforce change of +426 employees and a -1.5% year-over-year decline.
- The company listed 2,885 active job postings in 2026, marking a 40.7% increase compared with the previous year and indicating stronger hiring activity.
- Paramount employees earned an average salary of USD 90,000 and had an average tenure of 4.8 years.
- The company operated across 30 countries as of December 2025 and maintained 3,600 project-based staff.
Paramount Plus’s Content Spending By Genre
- Paramount Plus’s largest allocation goes to drama series, accounting for 30% of its total budget in 2024. This represents around $1.8 billion in spending.
Paramount Statistics also reports that Paramount Plus’s content spending by other genres is as follows in the table below.
| Genre | Content Spending (USD) | Budget Share |
| Comedy | 1.2 billion | 20% |
| Action/Adventure | 900 million | 15% |
| Reality TV | 600 million | 10% |
| Documentaries | 450 million | 7.5% |
| Family and Kids’ Shows | 300 million | 5% |
| Sports Content | 900 million | 15% |
| Other (News, Specials) | 150 million | 2.5% |
Viewer Awareness And Understanding Statistics By Major Streaming Services
(Reference: statista.com)
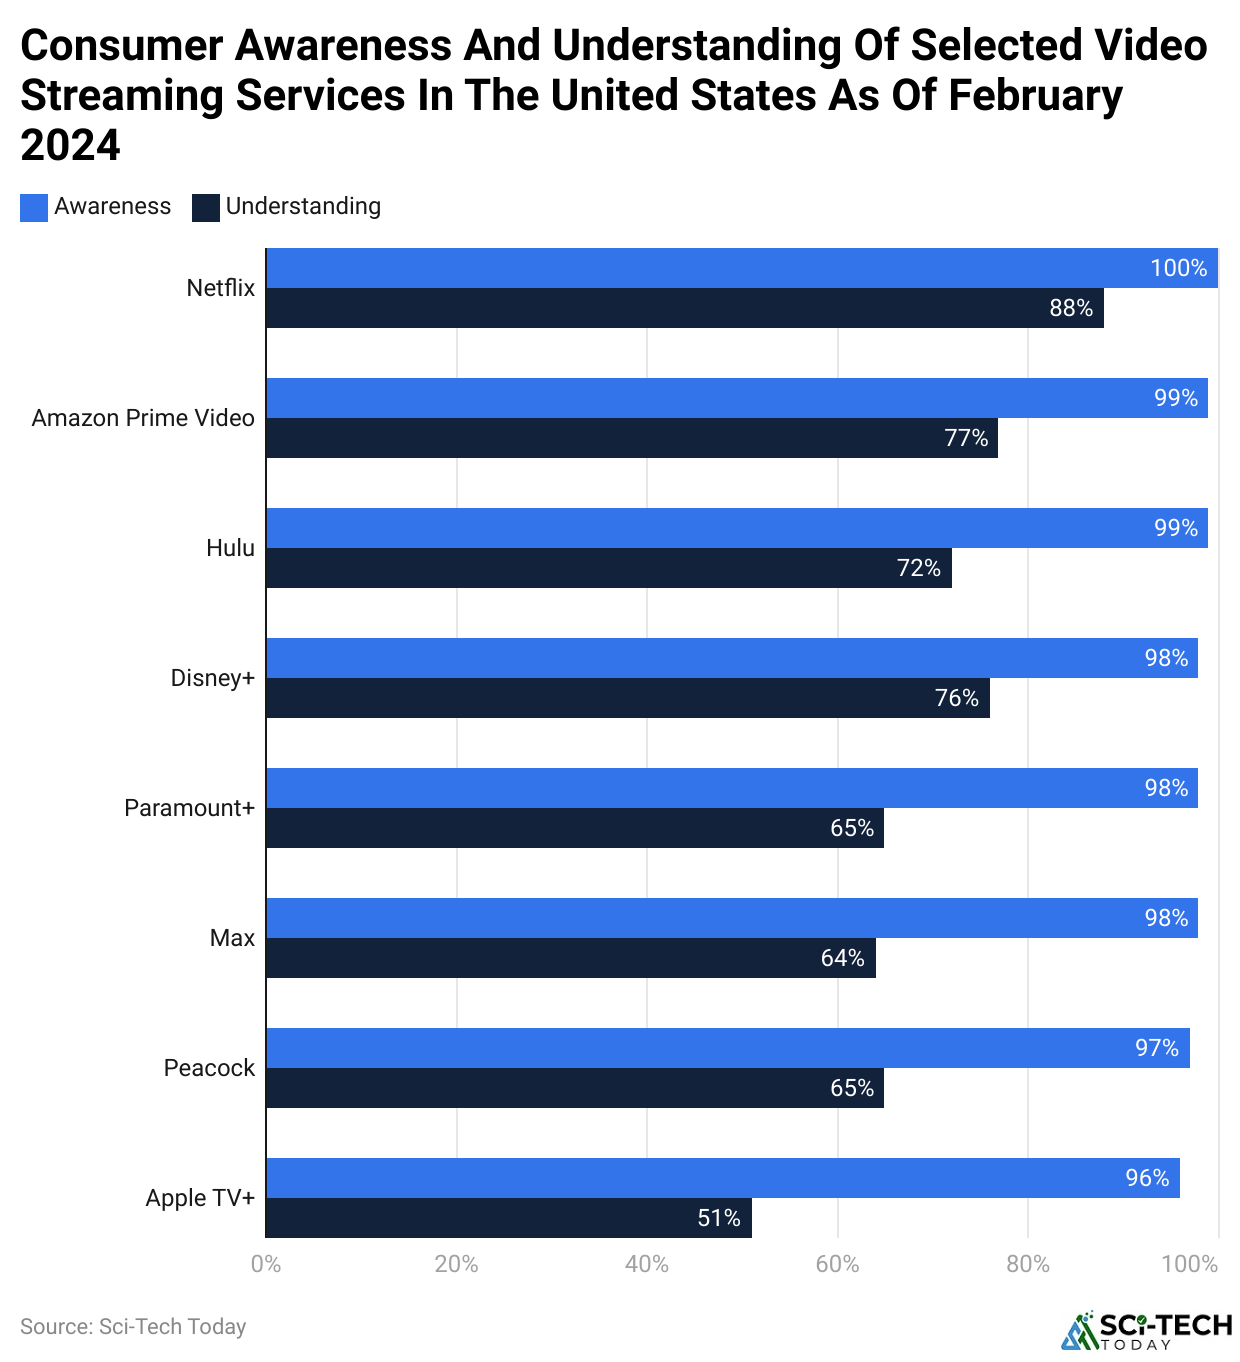
- In February 2024, almost 98% of people in the United States knew about Paramount Plus.
- At the same time, only 65% of consumers understood the platform.
Below is a table showing how well people in the U.S. know and understand various Subscription Video on Demand (SVOD) platforms in 2024.
| Video Streaming Services | Awareness | Understanding |
| Netflix | 100% | 88% |
| Amazon Prime Video | 99% | 77% |
| Hulu | 99% | 72% |
| Disney+ | 98% | 76% |
| Max | 98% | 64% |
| Peacock | 97% | 65% |
| Apple TV+ | 96% | 51% |
Paramount Plus Consumer Satisfaction Statistics
- In 2024, Paramount Plus received an overall customer satisfaction score of 78%.
- Meanwhile, 85% of users expressed satisfaction with the original content available on the platform.
- Paramount Statistics in 2024 state that Paramount Plus achieved a 92% satisfaction rate regarding streaming quality.
- Around 75% of users indicated satisfaction with the platform’s user interface and ease of navigation.
- About 72% of users felt that the pricing plans offered good value for money.
- Similarly, 80% of users appreciated the multi-device access, ensuring a great experience across phones, tablets, and smart TVs.
- Paramount Plus ensured around a 78% renewal rate with high satisfaction and loyalty among its subscribers.
Cancellation Rate Statistics By Different Streaming Platforms
| Platforms Names | Cancellation Rate |
| Max | 26.9% |
| Broadcast | 26.6% |
| Disney+ | 21.1% |
| Paramount+ | 16.9% |
| Hulu | 15.2% |
| Overall Streaming | 12.2% |
| Overall Linear TV | 10.8% |
| Netflix | 10.2% |
| Peacock | 10% |
| Prime Video | 9% |
| Cable | 7.2% |
| Apple TV+ | 4.9% |
ParamountPlus.com Website Traffic and Audience Overview
- ParamountPlus.com ranks #468 globally, #198 in the United States, and #12 in the U.S. Streaming & Online TV category.
- According to Similarweb, the platform recorded 92.4 million visits over the last 3 months, with monthly traffic increasing 29.89%.
- Visitors spend an average of 5 minutes 21 seconds on the site, view 3.84 pages per visit, and the bounce rate is 41.79%.
- The United States contributed 58.47% of website traffic, followed by Argentina (6.47%), Peru (5.45%), Chile (4.27%), Ecuador (4.15%), and other countries (21.19%).
Paramount+ Audience Profile, 2026
(Source: similarweb.com)
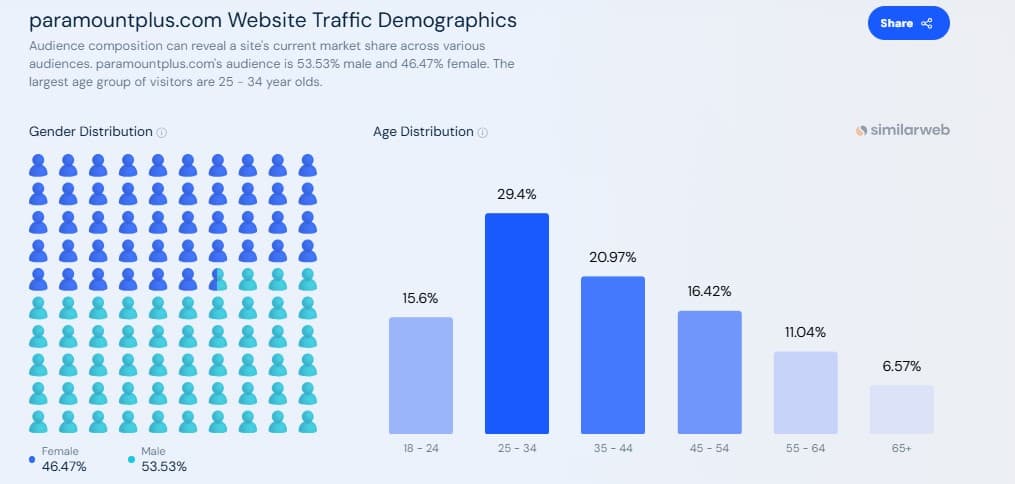
- Paramount+ skews slightly male, with 54.24% male viewers and 45.76% female viewers.
- Adults aged 25-34 years make up the largest share of the audience at 28.72%, followed by users aged 35-44 years, who account for 20.81% of total visitors.
- Younger users aged 18-24 represent 15.65%, while 45-54 years contribute 16.52%.
- Older cohorts are smaller, with 55-64 years at 11.44% and 65+ at 6.86%, indicating limited senior engagement.
Paramount Skydance Major Shareholders Overview, 2026
- Wallstreetzen reported that Gerald J. Cardinale (RedBird Capital) is the largest individual shareholder, holding 188.49 million PSKY shares, representing 16.84% ownership with an estimated value of USD 1.96 billion.
- David Ellison, Skydance founder and insider, owns 76.60 million shares, equal to 6.84% of PSKY, supported by the Ellison family investment in the merger.
- Lingotto Investment Management LLP holds 46.06 million shares as of June 30, 2026, representing 4.23% ownership and an equity value of USD 366.65 million.
- Nairi Inc owns 39.81 million shares, accounting for 3.56% of PSKY, valued at above USD 413.62 million.
- Sumner M. Redstone estate and related holdings hold 36.61 million shares, representing 3.27% ownership. Overall, institutional investors own 29.46%, insiders hold 36.43%, and retail investors own 34.12% of PSKY shares.
Top TV Shows on Paramount+
(Source: flixpatrol.com)
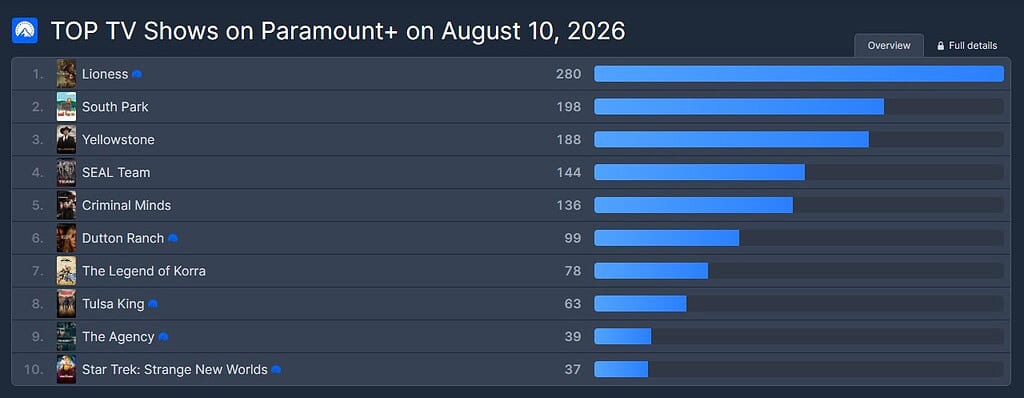
- On 4 August 2026, Lioness leads Paramount+ with a popularity score of 275.
- South Park follows at 190, while Yellowstone stands at 186 and SEAL Team at 142.
- Criminal Minds records 130 and The Legend of Korra 112.
- Tulsa King and Dutton Ranch each reach 84, Star Trek: Strange New Worlds is at 36, and Sabrina, the Teenage Witch is at 34.
Top Movies on Paramount+
- On 4 August 2026, Avatar Aang: The Last Airbender leads Paramount+ movies with a score of 272.
- Scream 7 follows at 162, The Last Stand of Ellen Cole at 144, and Top Gun: Maverick at 125.
- Primate scores 120, World War Z 119, RoboCop and Transformers: Rise of the Beasts 65, The Running Man 49, and Take Cover 34.
Paramount Skydance Merger and Streaming Expansion
- Paramount Global and Skydance Media received FCC approval to merge on July 24, 2025, and the merger officially became effective on August 7, 2025.
- Before the merger closed, Oracle was selected to help combine the technology behind Paramount+ and Pluto TV while keeping both services available.
- The merged company became Paramount Skydance Corporation. Tom Ryan, President of Paramount Streaming, now reports to Cindy Holland, who leads the direct-to-consumer division.
- On August 11, 2025, Paramount secured exclusive U.S. UFC broadcasting rights in a USD 7.7 billion, 7-year agreement. Starting in 2026, Paramount+ will exclusively stream all UFC events, while CBS will air selected fights, as per Wikipedia.
- On October 28, 2025, Paramount also acquired UFC broadcasting rights across Latin America and additional rights in Australia.
- On August 13, 2025, CEO David Ellison said the technology integration of Paramount+ and Pluto TV could be completed within 12-18 months, targeting November 2026.
Global Paramount Analysis by Key Opportunities
- Paramount+ grew to nearly 82 million subscribers, according to Yahoo Finance.
- Direct-to-consumer revenue rose 16% YoY.
- The Studios segment returned to profitability with adjusted EBITDA of USD 36 million, compared with a loss last year, while revenue increased 16%.
- The company expects to achieve more than USD 2.7 billion in annual run-rate cost savings by year-end and is targeting USD 3 billion+ from the Skydance-Paramount merger.
- The proposed Warner Bros. Discovery transaction has received approvals from 65 jurisdictions, and management remains confident the deal will close.
- Paramount raised its full-year adjusted EBITDA guidance to USD 3.8-3.9 billion and increased free cash flow conversion guidance to at least 10%.
- Paramount+, Pluto TV, and BET+ are expected to operate on a unified technology platform by the end of summer.
- The 2026 theatrical lineup has expanded to 15 films, including new Sonic the Hedgehog and Days of Thunder sequels.
- Live sports, including UFC and the FIFA World Cup, continued to drive strong engagement and subscriber growth.
Areas of Concern
- TV Media revenue declined as linear TV advertising fell 14% YoY in Q2 2026.
- The Warner Bros. Discovery deal could add USD 190 million in financing costs if completed by June 2027, while delays beyond September 30 may trigger USD 650 million per quarter in additional ticking fees.
- Paramount+ added 4 million underlying subscribers, but bundle exits reduced reported growth.
- Pluto TV remained weak in advertising, although management expects improvement in the second half of the year.
- Despite maintaining its USD 30 billion revenue outlook, higher content amortization may reduce Q3 adjusted EBITDA.
Summary
Paramount remains a major player in the global entertainment industry with its well-known TV networks, movie studios, and streaming services. The company is focusing on growing its digital business while continuing to support its traditional media operations.
Although streaming competition is increasing, Paramount is investing in original content and expanding its global reach. Its future growth will depend on attracting more viewers, improving profits, and adapting to changing audience preferences.
FAQ
Paramount owns brands such as Paramount Pictures, CBS, MTV, Nickelodeon, Comedy Central, BET, Showtime, Paramount+, and Pluto TV.
Paramount+ is Paramount’s subscription streaming service that offers movies, TV series, live sports, news, and exclusive original content.
Paramount creates feature films, television series, documentaries, children’s programming, sports broadcasts, and news content for audiences worldwide.

Sources