








Quick Verdict
Computer Modelling Group Q1 FY2027 Earnings were released, with the company reporting Q1 FY2027 EPS of C$0.02 and revenue of C$27.8 million, down 50% and 6% year over year, respectively. Results reflected weaker organic revenue and professional-services activity. Shares were modestly higher following the release, while CMG also announced a C$20 million share repurchase offer.
About Computer Modelling Group
Computer Modelling Group Ltd. (TSX: CMG) is a Calgary, Alberta-headquartered global software and consulting business serving the energy industry. It develops simulation, modelling, and technical consulting solutions for complex subsurface and surface challenges across the new-energy sector. The company also operates internationally, with offices in locations including Houston, Oslo, Stavanger, Oxford, Dubai, Bengaluru, and Kuala Lumpur.
CMG’s fiscal first-quarter results covered the three months ended June 30, 2026—labelled by the company as Q1 FY2027. The quarter showed the near-term effect of a previously disclosed customer loss, reduced non-core Bluware professional-services activity, and the absence of prior-year CoFlow development funding. Management said this was the final quarter affected by the lapping of the lost contract, after which year-over-year comparisons should normalize. CMG finished the quarter with C$17.7 million in cash, C$3.7 million in short-term investments, and C$7.8 million drawn on its revolving credit facility.
Top Financial Highlights
- Total revenue declined 6% year over year to C$27.8 million.
- Net income fell 60% to C$1.3 million, from C$3.3 million a year earlier.
- Basic and diluted EPS was C$0.02, compared with C$0.04 in Q1 FY2026.
- Gross profit was C$22.2 million, implying a gross margin of approximately 79.7%, versus 79.9% a year earlier.
- Adjusted EBITDA decreased 10% to C$6.4 million.
- Adjusted EBITDA margin was 23%, down from 24%.
- Recurring revenue decreased 3% to C$20.3 million.
- Total software-license revenue declined 2% to C$20.8 million.
- Professional-services revenue dropped 16% to C$7.1 million.
- Annuity/maintenance-license revenue decreased 5% to C$19.2 million.
- Free cash flow decreased 22% to C$3.5 million, or C$0.04 per share.
- Funds flow from operations was C$4.3 million, compared with C$5.5 million in the comparable quarter.
- Cash on hand was C$17.7 million at June 30, 2026, versus C$24.1 million at March 31, 2026.
- CMG declared a quarterly dividend of C$0.01 per common share, payable September 15, 2026, to shareholders of record on September 4, 2026.
- The Board approved a substantial issuer bid to repurchase up to C$20 million of common shares at a price range of C$4.00 to C$4.50 per share.
Quarterly Performance
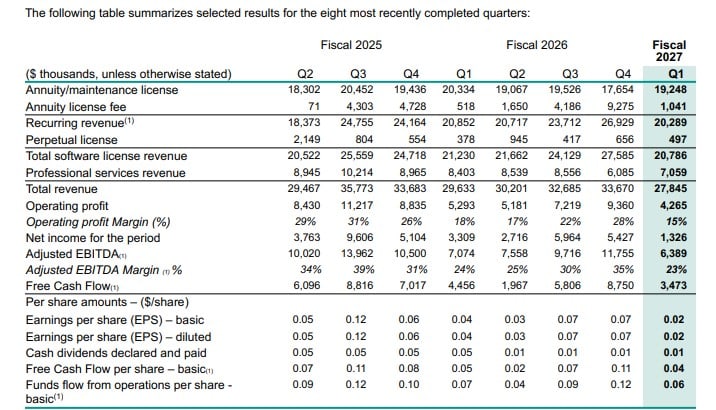
(source: cmgl.ca)
- The table summarizes the company’s quarterly financial performance across the eight most recently completed quarters, covering Fiscal 2025 Q2 through Fiscal 2027 Q1. The highlighted Fiscal 2027 Q1 results show total revenue of $27.85 million, including $20.79 million from software licenses and $7.06 million from professional services. Recurring revenue remained the core contributor at $20.29 million, representing approximately 73% of quarterly revenue.
- From an expert viewpoint, Fiscal 2027 Q1 indicates a moderation in profitability compared with Fiscal 2026 Q4. Operating profit declined from $9.36 million to $4.27 million, while the operating margin contracted from 28% to 15%. Net income decreased to $1.33 million, and adjusted EBITDA fell to $6.39 million, with the adjusted EBITDA margin declining to 23% from 35%. Free cash flow also moderated to $3.47 million from $8.75 million. Despite the sequential decline, the business continues to generate positive operating profit, EBITDA, and free cash flow, supported by a significant recurring-revenue base.
Condensed Consolidated Statements of Financial Position
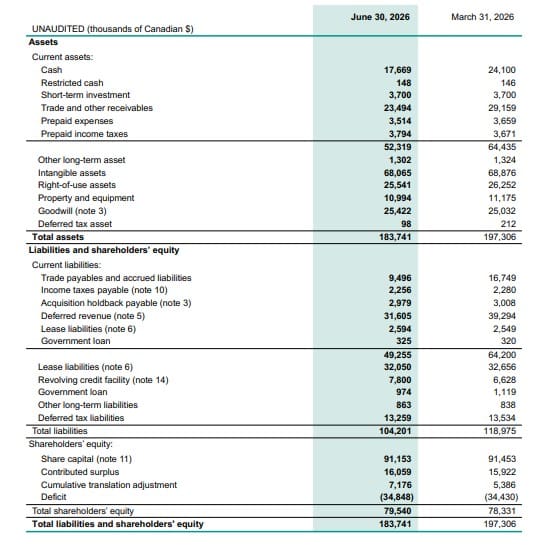
(Source: cmgl.ca)
- The image presents an unaudited consolidated balance sheet comparing the company’s financial position as of June 30, 2026, with March 31, 2026, with figures reported in thousands of Canadian dollars. Total assets declined to C$183.74 million from C$197.31 million, mainly reflecting lower cash, trade receivables, and other current assets. Cash decreased to C$17.67 million from C$24.10 million, while trade receivables fell to C$23.49 million from C$29.16 million. Current assets consequently declined to C$52.32 million from C$64.44 million.
- From an expert viewpoint, the balance sheet shows improved short-term liability management despite lower liquidity. Total liabilities decreased to C$104.20 million from C$118.98 million, largely due to lower trade payables and accrued liabilities and a reduction in deferred revenue. Current liabilities fell to C$49.26 million from C$64.20 million, resulting in positive working capital of approximately C$3.06 million, compared with only about C$0.24 million at March 31, 2026.
- Shareholders’ equity increased modestly to C$79.54 million from C$78.33 million, although the accumulated deficit widened slightly to C$34.85 million. Overall, the company’s balance sheet became smaller during the quarter, but its near-term liability position and equity base showed some improvement.
Beat or Miss?
CMG missed the third-party consensus figures cited in earnings-call coverage. Note that one media report inconsistently refers to C$20.29 million as revenue; CMG’s official release reports total revenue of C$27.845 million, while C$20.289 million is its recurring-revenue figure. The official company data should therefore be used for reported financials.
| Metric | Reported | Difference/Analysis |
| EPS | C$0.02 | Missed the cited C$0.037 consensus by C$0.017, or about 46% |
| Total revenue | C$27.8 million | Official reported revenue; cited external estimate of C$27.98 million would imply a modest C$0.14 million shortfall |
| Recurring revenue | C$20.3 million | Down 3% YoY, as acquisition growth did not offset organic contraction |
| Adjusted EBITDA | C$6.4 million | Down 10% YoY; cost control only partly offset lower revenue |
| Free cash flow | C$3.5 million | Down 22% YoY, affected by lower operating performance and higher tax impact |
The core issue was not pricing or gross-margin deterioration; it was a top-line mix and volume problem. Organic revenue declined 16%, while acquisition-driven revenue growth of 10% only partly cushioned the impact.
What Leadership Is Saying
The earnings release did not include attributable, verbatim CEO or CFO quotations. The following are management statements from the official release, presented without assigning a speaker.
“The current quarter represents the final quarter lapping that contract loss after which year-over-year comparisons are expected to normalize.”
“For fiscal 2027, relative to the prior year and excluding the impact of future acquisitions, we continue to expect organic Recurring revenue to be stable, no decline in Adjusted EBITDA, and improved Free Cash Flow.”
Management also expects recurring revenue to rise sequentially in Q2 due to a heavier renewal cycle. However, it expects professional-services revenue, adjusted EBITDA, and EBITDA margin to decline sequentially because Q2 is projected to be the low point for professional services and will include higher sales-and-marketing commissions associated with renewals.
Historical Performance
| Category | Q1 FY2027 | Q1 FY2026 | Change (%) |
| Revenue | C$27.845 million | C$29.633 million | -6% |
| Net income | C$1.326 million | C$3.309 million | -60% |
| Operating expenses | C$17.919 million | C$18.382 million | -3% |
| Operating profit | C$4.265 million | C$5.293 million | -19% |
| Adjusted EBITDA | C$6.389 million | C$7.074 million | -10% |
| Free cash flow | C$3.473 million | C$4.456 million | -22% |
The relatively modest reduction in operating expenses did not match the scale of the profit decline because lower revenue, a higher tax expense, finance costs, and foreign-exchange losses weighed on net income.
Competitor Comparison
CMG’s release does not report earnings from named competitors, so an apples-to-apples competitor financial comparison cannot be substantiated from the supplied source. The closest useful operational comparison is between CMG’s principal revenue streams.
| Category | Q1 FY2027 | Q1 FY2026 | Change (%) |
| Recurring revenue | C$20.289 million | C$20.852 million | -3% |
| Total software-license revenue | C$20.786 million | C$21.230 million | -2% |
| Professional-services revenue | C$7.059 million | C$8.403 million | -16% |
| Annuity/maintenance licenses | C$19.248 million | C$20.334 million | -5% |
| Perpetual licenses | C$0.497 million | C$0.378 million | 31% |
The data indicate that recurring software revenue was comparatively resilient, whereas professional services was the primary drag. Management attributed this to the disappearance of prior-year CoFlow-related development funding and the continued wind-down of non-core Bluware services.
How the Market Reacted?
Third-party earnings-call coverage reported that CMG shares were up 1.33% to C$3.80 after closing at C$3.75, suggesting a mildly constructive immediate reaction despite the earnings miss. Investors may have focused on management’s expectation that the lost-customer comparison effect will end after this quarter, the maintained full-year operating outlook, the C$0.01 dividend, and the announced C$20 million issuer bid. Still, the report was fundamentally mixed-to-bearish: revenue, EPS, EBITDA, and free cash flow all declined year over year

Sources


