








Overview
Mobile Commerce Statistics: Smartphones and other mobile devices have become essential tools, deeply integrated into our daily lives. From managing schedules to consuming media, our phones are rarely out of reach, and this constant connection has fundamentally changed how we shop. This shift has given rise to mobile commerce, or m-commerce, which has quickly surpassed traditional desktop e-commerce in many key metrics.
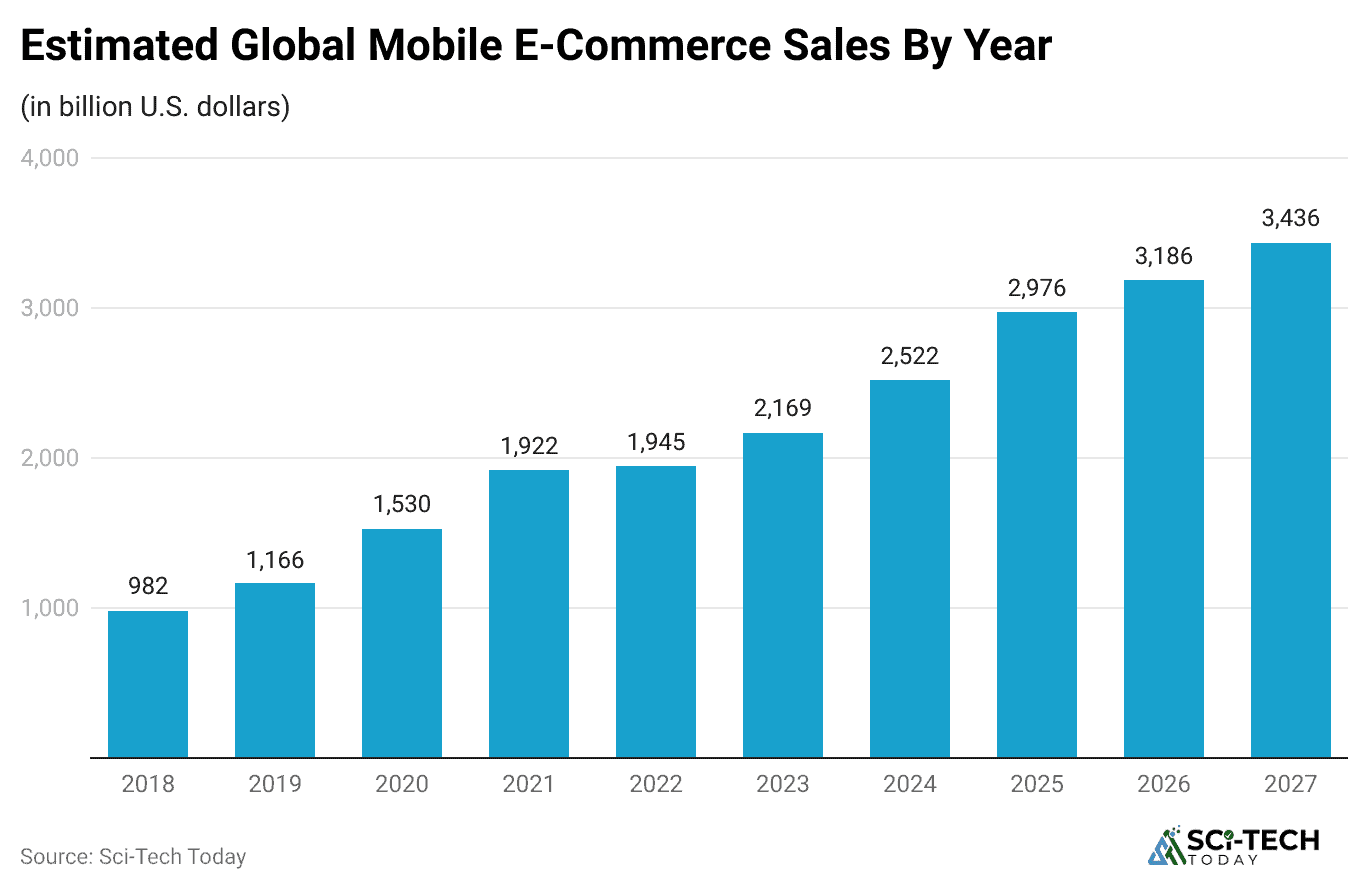
Mobile commerce will become a powerful driving factor in e-commerce by the year 2026. The analysis of statistics has proven that customers find it more convenient to buy while moving, which makes the development of mobile sites and applications an absolute necessity for any successful business. Industry analysts project that the number of active mobile commerce buyers in the US alone will exceed 187 million by 2024. Furthermore, by 2025, mobile commerce sales are forecasted to approach USD 4.01 trillion globally, demonstrating their undeniable gravity in the modern economy.
I’d like to discuss the most critical and up-to-date mobile commerce statistics and trends, providing a complete blueprint for understanding where the market is today and where it is heading. Let’s get started.
Spotlighted by the Editor
- A one-second delay in mobile page load time can reduce retail conversion rates by up to 20%, although the exact impact varies by website, audience, and checkout experience.
- This means that if a site loads in five seconds instead of the preferred one-to-two-second range, it may lose a substantial share of potential sales due to user impatience. Sites loading in one second can convert 2.7 times better than those loading in five seconds.
- Mobile users generally tolerate a maximum page load time of about three seconds before drop-off becomes significant. Around 40% of consumers abandon a site that takes longer than three seconds to load.
- If a mobile webpage takes longer than three seconds, 53% of mobile visitors may leave the page. Additionally, bounce probability increases by 32% as load time rises from one to three seconds and by 90% as it rises from one to five seconds.
- Approximately 67% of mobile users cite pages and links that are too small to click, or related usability barriers, as a major obstacle to completing purchases on mobile devices. This technical friction remains a key contributor to high mobile-cart abandonment.
- Dedicated mobile shopping apps generally convert users at a rate around 2 to 3 times higher than mobile websites. A 2025 benchmark reported app conversion at 6.14%, versus 1.57% for mobile sites.
- While mobile web conversion typically ranges around 1.7%, strong native shopping apps can exceed 5%.
- Users view substantially more products per session in mobile shopping apps. The latest comparable benchmark found 22 products per app session, versus 5.7 on mobile websites about 286% more, rather than merely twice as many.
- A current, broadly reliable 2025 benchmark for average revenue per shopping-app download could not be identified. The USD 23.99 revenue-per-download figure should therefore be removed rather than presented as a current industry average.
- Cart abandonment on mobile remains the highest across major device types, at approximately 80.2% in 2025, compared with about 70% on desktop. The overall cross-device cart-abandonment average was 70.22%.
- Mobile abandonment is therefore roughly 10 percentage points higher than desktop abandonment, not 65% versus 7%, as in the original wording.
- A major reason for cart abandonment remains checkout friction. In 2025, 18% of shoppers abandoned their carts because a website required them to create an account before purchase, down from the earlier 26% figure.
- The most common reason for abandoning a purchase was still high extra costs such as shipping, taxes, and fees, accounting for 40% of cart abandonment in 2025.
- Generation Z buyers increasingly begin product discovery on social platforms. In 2025, 53.6% reported finding products most often via Instagram (30.4%) or TikTok (23.2%), compared with 18.8% who named Google as their top discovery source.
- Secure, seamless payment is a market expectation, not a feature. Digital wallets, including Apple Pay, Google Pay, PayPal, and local wallet options, accounted for 56% of global e-commerce spending in 2025, rather than 52% of mobile transactions specifically.
What is Mobile Commerce and Why Is It the Retail Future?
(Reference: redline.digital)
Mobile commerce encompasses any monetary transaction performed using a wireless handheld device, such as a smartphone or tablet. This includes retail shopping, mobile banking, digital payments, and mobile ticketing. The reason for its explosive growth is simple: it offers convenience, allowing consumers to complete purchases instantly from virtually any location.
The distinction between e-commerce and mobile commerce is increasingly critical for businesses. E-commerce is the umbrella term for any digital transaction, while mobile commerce specifically refers to those executed via mobile devices. Given that the majority of online traffic and sales now flow through the smaller screen, prioritizing a seamless mobile experience is paramount.
- By the end of 2025, the share of worldwide e-commerce sales executed via mobile devices has grown further, with smartphones accounting for nearly 80% of all retail website visits globally, though the transaction share specifically remains in the 58% range based on regional data, such as the U.S. figure of 44.2% of retail e-commerce sales via mobile.
- This means that for every dollar spent online globally, a majority still originates from a phone or tablet, cementing the mobile-first imperative, even as the exact global transaction-share percentage varies by source and region.
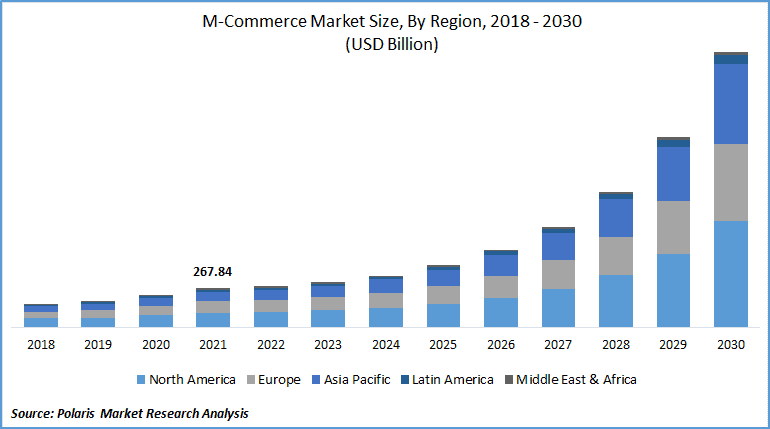
- Forecasts suggest a compound annual growth rate (CAGR) of around 26.1% for the global mobile commerce market from 2025–2030 (per NMSC), or 8.09% per a more conservative estimate covering 2026–2031, both significantly outpacing overall e-commerce growth.
- With an estimated 5.28 billion smartphone users in use worldwide in 2025, the potential audience for mobile commerce now covers roughly 80% of the global population, depending on the measure used.
- As of 2025, approximately 63.8% of global website traffic came from mobile devices, a figure that continues to climb from 58% in late 2023.
- Nearly 90% of consumers aged 18–39 report using their smartphones while grocery shopping in-store, primarily for checking prices, reading reviews, comparing products, or searching for coupons, a modest rise from the 89% figure previously cited.
- Younger Consumers’ Clear Preference: Among the crucial Millennial demographic, roughly 69% state a distinct preference for shopping online over in-store, with 55% specifically preferring mobile apps over desktop, up sharply from 30% in 2018.
| Global E-commerce Share 2024 | 44.2% of all e-commerce sales come from mobile devices. |
| Projected Global Sales 2025 | Expected to reach between USD 4.01 and USD 6.5 trillion. |
|
Smartphone Users 2024 | Approximately 6.94 billion devices in use worldwide. |
| Annual Growth Rate | Forecasted to grow at a CAGR of about 26.1%. |
Mobile Commerce Market Size
(Source: polarismarketresearch.com)
- The global digital commerce market is projected for significant expansion, rising from USD 8.0 billion in 2025 to USD 31.8 billion by 2034.
- This growth represents a robust Compound Annual Growth Rate CAGR of 16.5% over the forecast period 2025 to 2034.
- Market growth is mainly spurred by technological innovations and a trend among customers to personalize and engage better with their experience.
- Digital Wallets have been chosen as the preferred way of transacting and account for more than 50% market share.
- Solutions Platforms/Software has the largest market share of above 62.5%, due to the requirement of specialized solutions for online transactions.
- Mobile and Tablets are the most popular access devices and account for more than 65.7% of the market share because of the popularity of smartphones globally.
- Business-to-Business B2B transactions lead the field, capturing over 59.6% of the market due to high transaction volumes and aggressive digital transformation efforts.
- The Automotive sector was the single largest vertical, holding over 31% of the digital commerce market.
- The APAC region is the undisputed market leader, holding a dominant 56.7% share in 2024, generating approximately USD 3.9 trillion in revenue.
- This strong regional performance is attributed to rapid digital adoption, a growing middle class, and soaring smartphone and internet penetration in key markets like China and India.
| Market Value Growth | From USD 8.0 Billion 2025 to USD 31.8 Billion 2034 | N/A |
| CAGR 2025 to 2034 | 16.5% | N/A |
| Leading Region | N/A | Asia-Pacific APAC: 56.7% share approx. USD 3.9 trillion revenue |
| Leading Device Type | N/A | Mobile and Tablets: Over 65.7% share |
| Leading Transaction Type | N/A | Business-to-Business to B2B: More than 59.6% share |
| Leading Payment Method | N/A | Digital Wallets: Exceeding 50% share |
| Leading Offering Type | N/A | Solutions Platforms/Software: More than 62.5% share |
| Leading Vertical | N/A | Automotive: Over 31% share |
Subscription-Based E-commerce Market S-Commerce
(Source: market.us)
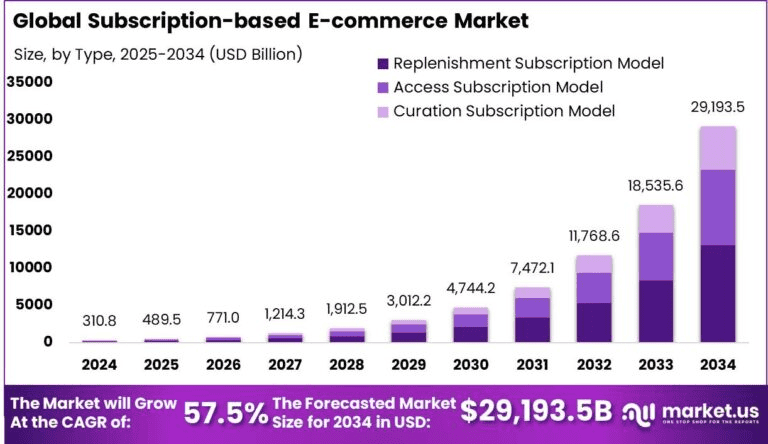
According to market.us, this section highlights the hyper-growth and consumer loyalty aspects of the subscription model.
- The subscription-based e-commerce market is forecast for dramatic growth, surging from USD 489.5 billion in 2025 to an astonishing USD 29,193.0 billion by 2034.
- This translates to an exceptional Compound Annual Growth Rate CAGR of 57.5% over the period.
- Growth is propelled by Millennials and Gen Z, who value convenience, flexibility, and personalization in their purchasing habits.
- The Replenishment Subscription Mode, with automatic re-ordering of everyday goods, holds the largest segment share, exceeding 45%, driven by demand for consistency and ease.
- Food & Beverage is the leading product segment, capturing over 30% of the market, reflecting consumer preference for convenient, quality dietary options.
- North America holds the largest regional share, accounting for over 41% of the market and generating approximately USD 127 billion in 2024.
- The U.S. market alone was valued at roughly USD 119.5 billion in 2024, with a projected CAGR of 52.8%.
- The subscription approach is very useful when it comes to fostering customer loyalty since loyal customers generate a 306% higher lifetime value than satisfied ones.
- The subscription model makes shopping easy for customers as 29% of them have already subscribed to retail stores.
| Market Value Growth | From USD 489.5 Billion in 2025 to USD 29,193.0 Billion in 2034 | N/A |
| CAGR 2025–2034 | 57.5% Hyper-growth | N/A |
| Leading Region | N/A | North America: Over 41% share approx. USD 127 Billion |
| U.S. Market Value | CAGR of 52.8% projected | Approx. USD 119.5 Billion |
| Leading Model Type | N/A | Replenishment Subscription Model: More than 45% share |
| Leading Vertical | N/A | Food & Beverage: Over 30% share |
| Customer Loyalty Impact | 306% higher Lifetime Value | N/A |
| Consumer Adoption | N/A | 29% of consumers opt for retail subscriptions |
The Conversion Challenge By Mobile App vs. Mobile Web
(Source: buildfire.com)
- The current average cart abandonment rate on mobile sites stands at a staggering 85.65%, as per the latest statistics.
- Compared to the desktop cart abandonment rates that lie around 73% to 76%, this figure clearly demonstrates the underlying pain points in the checkout process on mobile browsers.
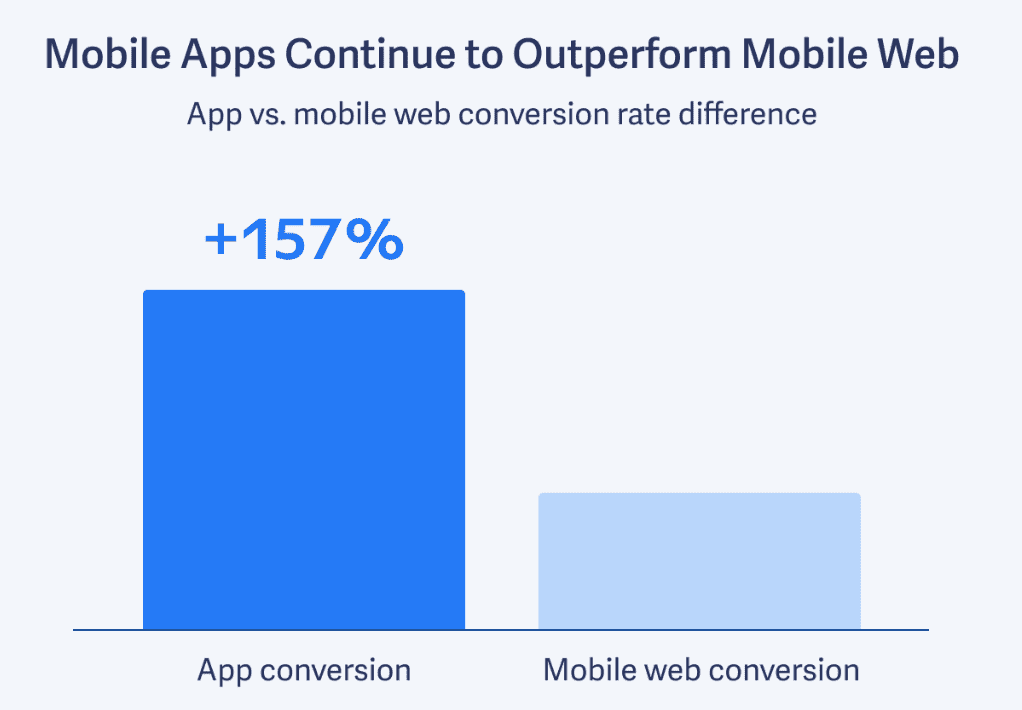
- Mobile shopping applications achieve user conversion rates that are about 3x better than those achieved by mobile sites.
- The huge disparity, with mobile apps achieving a rate of about 3.5% compared to mobile sites achieving 2%, makes a strong case for the development of applications rather than just optimizing sites.
- Users tend to see four and a half times as many products while using a mobile shopping application as compared to a mobile site.
- In addition, users also spend about 201.8 minutes each month shopping on mobile apps as compared to just 10.9 minutes shopping on mobile sites, thus demonstrating greater engagement and loyalty.
- According to statistics, an average mobile shopping application generates revenue of USD 23.99 per download.
- This hard metric demonstrates the clear financial return on investment for building a robust native application experience.
- Roughly 70% of mobile commerce purchases are completed through a mobile app rather than a mobile browser.
- Curiously, the average order value AOV on desktop remains higher, often around USD 155, compared to the mobile AOV of about USD 112.
| Average Conversion Rate | 2.0% | 3.5% 3x higher |
| Cart Abandonment Rate | 85.65% Alarmingly High | 20% Significantly Lower |
| Product Views per Session | Standard rate | 4.2 times more than mobile web |
| Average Order Value AOV | USD 112 | Often 10% higher than the mobile web |
Advanced Mobile Commerce Trends and Technologies
(Source: coherentmarketinsights.com)
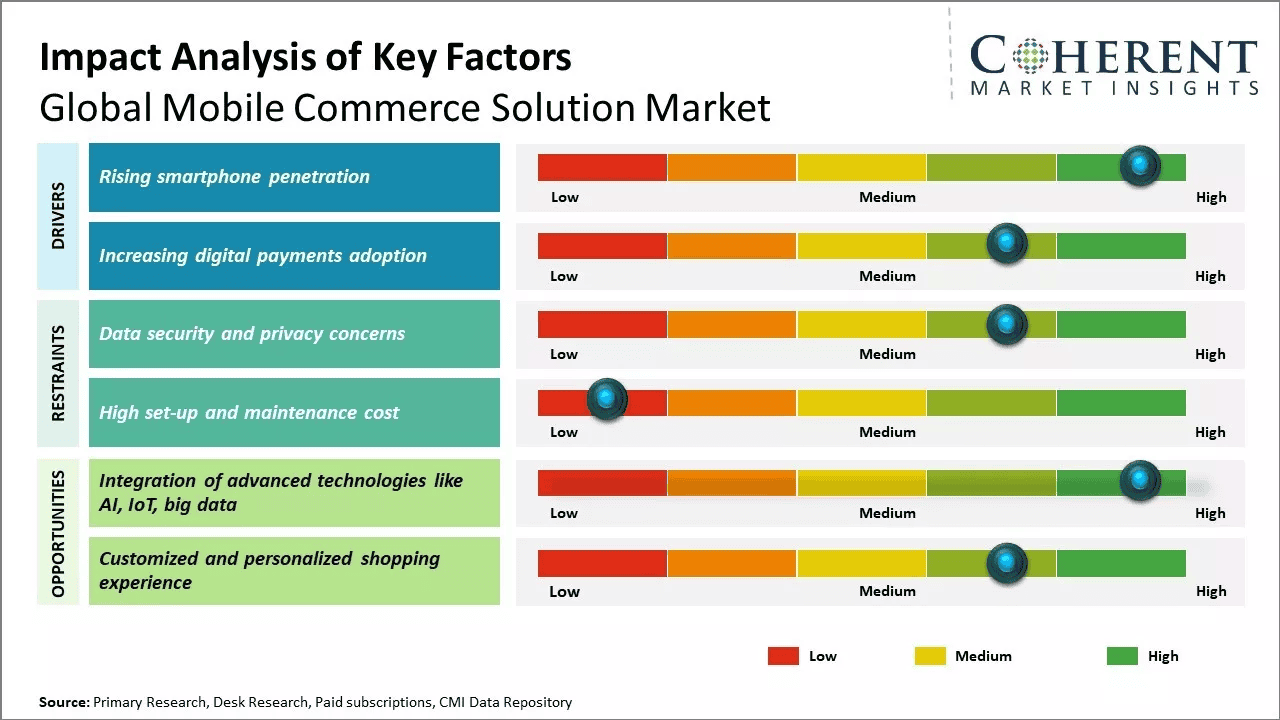
- Mobile payment systems, such as digital wallets including Apple Pay and Google Pay, comprise more than 52% of total mobile payments worldwide.
- Voice-enabled shopping is moving from niche to mainstream, with global transaction value projected to surge to over USD 164 billion by 2025.
- This can be associated with the figure that 71% of users today prefer searching by voice as compared to typing, as hands-free shopping becomes increasingly convenient.
- AR features within mobile commerce apps lead to significantly higher engagement. Data from the Harvard Business Review shows that users engaging with an AR function dedicate 20.7% more time within the mobile application and view 28% more products.
- Social media is rapidly converting influence into direct transactions. Social commerce sales are forecasted to hit USD 1.2 trillion globally by 2025.
- A key driver is that 70% of Gen Z buyers use platforms like Instagram and TikTok for product discovery, demonstrating that the shopping journey often begins outside of traditional retailer websites.
- Utilizing mobile data for messaging has enormous returns. Highly personalized mobile push notifications have been shown to increase conversion rates by up to 88% when used correctly.
- Implementing intelligent chatbots is a rising trend, primarily because they provide both convenience and cost savings.
- Businesses utilizing AI-powered chatbots can reduce customer support costs by up to 30%, while also providing instant, 24/7 service that meets the impatient demands of the mobile shopper.
| Digital Wallet Transaction Share | Over 52% of all mobile transactions. |
| Voice Shopping Market Value 2025 | Projected to exceed USD 164 billion globally. |
| AR Engagement Impact | Users spend 20.7% more time in apps with AR features. |
| Social Commerce Value 2025 | Expected to reach USD 1.2 trillion worldwide. |
| Personalized Notification Uplift | Can boost conversions by up to 88%. |
Regional and Demographic
(Source: polarismarketresearch.com)
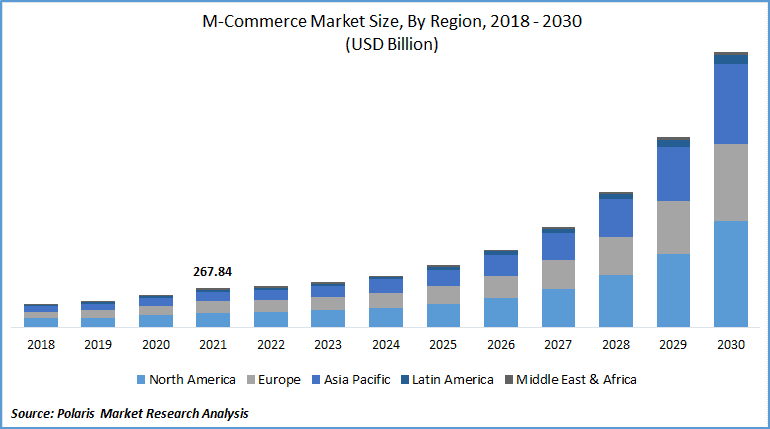
- The Asia-Pacific region is the undisputed leader in mobile commerce adoption, accounting for over 52% of all global mobile commerce sales.
- This is largely driven by the sheer scale and high smartphone penetration rates in markets like China and South Korea, where mobile-driven sales penetration is expected to hit 77% by 2026.
- While the Asia-Pacific region leads in penetration, North America represents the largest single market in terms of value, estimated at USD 1.54 trillion in 2025.
- According to analysts, mobile is going to represent up to 70% of the total number of sales done through e-commerce in this area in the coming years.
- Generation Z, which consists of individuals aged between 12 and 27, represents the most mobile generation since 99% of this group uses mobile banking apps.
- In terms of transactions, 70% of Generation Z utilizes social media for the purpose of discovering products and making small-value purchases frequently.
- Although Generation Z is very much engaged, the other group that constitutes the biggest spenders is the Millennials, aged between 28 and 43.
- 83% of individuals who use smartphones have bought something on the internet, with the Millennials being at the core of these individuals.
- The older generations are slowly but surely adopting mobile commerce. While they are the slowest to embrace mobile wallet payments, only about 28% of Boomers use them, their sheer purchasing power means that a well-designed, easy-to-navigate mobile site remains a crucial focus.
- For all ages, a significant proportion of buyers make use of their smartphones even as they are inside a physical store.
- According to one survey, around 74% of American buyers make use of their mobile phones for doing research on products even as they are inside the retailer’s premises.
| Global Leader in Sales Volume | Asia-Pacific, accounting for 52% of global sales. |
| E-commerce Penetration in North America | Expected to reach 70% via mobile devices. |
| Gen Z Banking App Usage | 99% use a mobile banking app. |
| Global Mobile Purchase Rate | Approximately 83% of all smartphone users have made a purchase. |
The Origin and Evolution of Mobile Commerce
(Source: payu.com)
- 1997: The First M-Commerce Transaction: The history of mobile commerce is often traced to the late 1990s.
- 2003: The Mobile Ticketing Revolution: This period saw the first widespread use of mobile ticketing, particularly in Japan, with airlines and event venues using mobile phones as digital boarding passes and entry tickets.
- 2007: The iPhone and UX Shift: The launch of the Apple iPhone fundamentally changed consumer expectations.
- Before 2007, browsing on a mobile device was cumbersome; post-2007, the focus shifted to touch-friendly, intuitive mobile experiences, paving the way for sophisticated mobile commerce apps.
- 2014: The Digital Wallet Milestone: The introduction of Apple Pay marked a significant shift toward secure, biometric-based digital wallet payments.
- This was a critical security milestone, alleviating consumer fears and accelerating the adoption of in-store and in-app mobile payments.
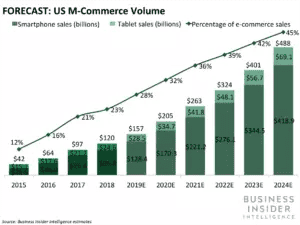
- 2016: Mobile Takes the Lead: By 2016, a critical tipping point was reached when 52.4% of retail e-commerce sales were executed via mobile devices.
- 2020: The Pandemic Accelerator: The COVID-19 pandemic acted as an unprecedented accelerator for mobile commerce.
- Retail m-commerce sales experienced an 18% growth from the previous year, as locked-down consumers relied exclusively on their phones for necessities and purchases, locking in new habits that have persisted.
| Year Mobile Surpassed Desktop | 2016, at 52.4% of e-commerce sales. |
| Digital Wallet Catalyst | 2014 Launch of Apple Pay. |
| Pandemic Growth Factor | Sales grew by 18% in 2020 alone. |
Summary
Overall, the future of retail is undeniably in the palm of the consumer’s hand. The volume of data, from the USD 4.01 trillion market size projection for 2025 to the 3x higher conversion rates on native apps, makes the case for a comprehensive mobile commerce strategy unassailable.
In order to thrive in this age of digital business, continuous optimization is essential. It entails the removal of all potential friction points, such as slow loading times and complex checkout processes, while also using innovative technologies such as AR and AI personalization. The future of brands over the coming five years will lie in those that have used the mobile device not as a miniaturized version of their website but as a highly personalized platform of commerce. I hope you enjoyed this content.
FAQ
Mobile commerce, or m-commerce, means buying and selling things like goods, services, and tickets using a phone or tablet. It lets you do money tasks anywhere instead of using a desktop computer.
The primary advantages of mobile commerce include unmatched convenience, faster transactions, and a wider market reach.
E-commerce is the buying and selling of goods using any electronic device via the internet. M-commerce, or mobile commerce, is a subset of e-commerce that strictly uses mobile devices like smartphones and tablets.


