








Quick Verdict
In the latest XP Inc. Q2 2026 Earnings report, XP Inc. reported adjusted diluted EPS of R$2.67, up 9% year over year, on R$5.06 billion of gross revenue, up 8%. Both earnings and revenue exceeded reported consensus expectations, but shares fell 0.76% in regular trading and another 1.15% pre-market amid concerns around fixed-income mix and mark-to-market pressure.
About XP Inc.
XP Inc. (NASDAQ: XP) is a Brazilian financial-services and capital-markets platform founded in 2001. It is legally based in George Town, Cayman Islands, while its operating franchise is focused on Brazil. Led by CEO Thiago Maffra, XP operates an open-architecture financial ecosystem spanning investment brokerage, wealth management, fixed income, funds, pensions, insurance, credit cards, lending, investment banking, foreign exchange, derivatives, and institutional services.
The company had approximately 8,069 full-time employees in its latest profile data, while its reported end-quarter headcount was 8,491, reflecting continuing investment in people and technology. XP’s market capitalization was about $8.21 billion at the August 17 close of $15.70 per share. The stock traded at a trailing P/E of 8.3x, reported trailing dividend yield of 2.0%, and trailing EPS of $1.91.
XP’s second-quarter story is one of broad-based platform expansion and capital strength, partially offset by credit-market volatility. Management emphasized resilient underlying activity in equities, funds, retail new verticals, and corporate banking, while fixed-income revenue faced adverse product-mix and mark-to-market effects.
Top Financial Highlights
- Gross revenue reached R$5.056 billion, increasing 8% YoY and 3% QoQ.
- Net revenue was R$4.884 billion, up 9% YoY and 3% sequentially.
- Adjusted net income totaled R$1.384 billion, a 5% YoY and 5% QoQ increase.
- Adjusted diluted EPS was R$2.67, up 9% YoY and 7% QoQ; adjusted basic EPS was R$2.71.
- Gross profit rose 9% YoY to R$3.353 billion.
- Gross margin was 68.6%, essentially flat from 68.7% a year earlier but up 148 basis points from 67.2% in Q1 2026.
- Earnings before taxes were R$1.565 billion, up 15% YoY, with EBT margin expanding 172 basis points to 32.0%.
- Retail revenue was R$3.881 billion, up 8% YoY and 3% QoQ; its biggest contributors were equities at R$1.138 billion, fixed income at R$833 million, and other retail at R$813 million.
- Wholesale banking revenue climbed 32% YoY to R$1.175 billion, driven by a 117% increase in corporate revenue to R$606 million.
- Funds-platform revenue increased 23% YoY to R$418 million, while cards, credit and insurance revenue grew 16%, 27%, and 23%, respectively.
- Fixed-income revenue declined 16% YoY to R$833 million, as clients shifted heavily toward lower-take-rate daily-liquidity products and the business faced mark-to-market effects.
- Total client assets reached R$1.535 trillion, rising 12% YoY, while quarterly net inflows were R$28 billion, up 188% from R$10 billion a year earlier.
- Cash was R$7.978 billion at quarter-end, compared with R$8.791 billion at the end of Q1 2026. The company also held R$377.229 billion in financial assets.
- XP completed approximately R$1 billion of buybacks under a prior program and retained another R$1 billion authorization; management expects 2026 distributions to exceed 50% of earnings through dividends and repurchases.
Accounting Income Statement (in R$ mn)
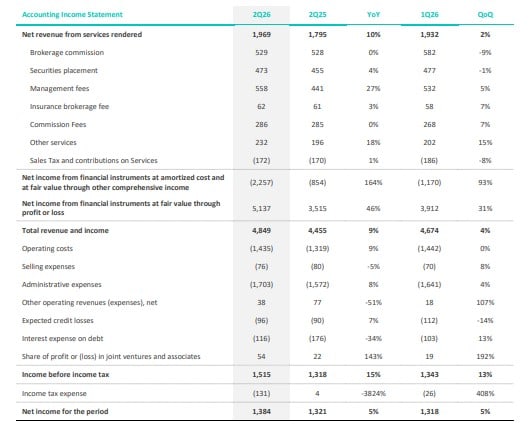
(Source: investors.xpinc.com)
Beat or Miss?
XP beat consensus figures reported by third-party earnings coverage, though investors should note a potential reporting-currency/unit inconsistency in market-data services. The company itself reported figures in Brazilian reais; external consensus data compare R$4.849 billion of net revenue with a reported $935.1 million estimate, which may represent USD-translated values or a data-normalization issue. The cleanest comparison is the independently reported R$2.67 adjusted EPS versus the R$2.59 consensus and approximately R$5.1 billion gross revenue versus an approximately R$5.0 billion forecast.
| Metric | Reported | Difference/Analysis |
| Adjusted diluted EPS | R$2.67 | Beat the reported consensus of R$2.59 by R$0.08, or roughly 3.1%. |
| Gross revenue | R$5.056 billion | Slightly above the reported approximately R$5.0 billion forecast. |
| Net revenue | R$4.884 billion | Finance-data earnings history lists R$4.849 billion versus a $935.1 million estimate; this is not directly comparable without standardized currency translation. |
| Adjusted net income | R$1.384 billion | Increased 5% YoY, but growth trailed the 15% increase in EBT because of higher tax expense. |
| EBT margin | 32.00% | Expanded 172 bps YoY and 209 bps QoQ, indicating improved operating leverage despite revenue-mix pressure. |
| Formal Q3 outlook | N/A | No numerical revenue or EPS guidance. Management maintained a double-digit full-year revenue-growth target. |
What Leadership Is Saying
“Our comprehensive financial ecosystem is built around long-term relationships. We provide service and personalized advice with excellence across every aspect of our clients’ financial lives, from investments to banking solutions.”
— Thiago Maffra, Chief Executive Officer, on XP’s strategy to expand from product distribution into broader wealth planning and banking relationships.
“We delivered a good efficiency ratio against a more challenging revenues background.”
— Gustavo Alejo, Chief Financial Officer, on cost discipline as XP continues investment in technology, cloud infrastructure and AI capabilities.
Management also said it intends to launch an SME platform on September 1, combining services such as cards, payments/acquiring, and collateralized credit, and is preparing an AI adviser for digital retail customers around late August or early September. These initiatives are part of a gradual ecosystem-expansion strategy, rather than a shift toward aggressive balance-sheet risk-taking.
Historical Performance
| Category | Q2 2026 | Q2 2025 | Change (%) |
| Gross revenue | R$5.056 billion | R$4.669 billion | 8% |
| Net revenue | R$4.884 billion | R$4.499 billion | 9% |
| Adjusted net income | R$1.384 billion | R$1.321 billion | 5% |
| Earnings before taxes | R$1.565 billion | R$1.364 billion | 15% |
| SG&A expenses | R$1.640 billion | R$1.561 billion | 5% |
| Gross profit | R$3.353 billion | R$3.090 billion | 9% |
| Diluted EPS | R$2.67 | R$2.46 | 9% |
| Total client assets | R$1.535 trillion | R$1.372 trillion | 12% |
(Source: XP’s 2Q26 earnings release.)
Competitor Comparison
A strict Q2 2026-versus-Q2 2025 financial comparison for direct competitors is not appropriate from the materials reviewed: XP’s closest comparable companies report under different currencies, accounting conventions, fiscal calendars, and business mixes. The finance peer screen identifies capital-markets and investment-services comparables including Futu Holdings, StoneX Group, Virtu Financial, Freedom Holding, Raymond James, Stifel Financial, MarketAxess, Nomura, SEI Investments, and Jefferies.
Instead, the table below provides an earnings-period comparison within XP’s principal competitive operating contexts—Brazilian retail investing, wealth management, and wholesale/corporate financial services—rather than presenting non-comparable competitor financials as if they represented a like-for-like benchmark.
| Category | XP Q2 2026 | XP Q2 2025 | Change (%) |
| Retail revenue | R$3.881 billion | R$3.577 billion | 8% |
| Wholesale banking revenue | R$1.175 billion | R$889 million | 32% |
| Corporate revenue | R$606 million | R$279 million | 117% |
| Funds-platform revenue | R$418 million | R$341 million | 23% |
| Fixed-income revenue | R$833 million | R$988 million | −16% |
| Issuer-services revenue | R$186 million | R$268 million | −30% |
| Institutional revenue | R$383 million | R$343 million | 12% |
The competitive implication is clear: XP’s fastest expansion came from corporate and wholesale solutions, while the material weak point was fixed income and issuer services, both affected by market risk appetite, reduced debt issuance, and a client shift to short-duration liquidity products.
How the Market Reacted?
XP shares closed August 17 at $15.70, down $0.12, or 0.76%, on the day. In pre-market trading on August 18, the shares were quoted at $15.52, down another $0.18, or 1.15%, versus the regular-session close.
The immediate market response was therefore cautious despite the earnings beat. Investors appear to have focused on fixed-income fee compression, the residual mark-to-market impact in credit-related activities, and the lower year-over-year net margin, which fell 103 basis points to 28.3%. Nevertheless, XP retained its full-year double-digit revenue-growth target, posted robust corporate-banking momentum, and continued shareholder-return actions through buybacks and dividends.

Sources


