









Quick Verdict
Evertz Technologies reported Q1 fiscal 2027 diluted EPS of C$0.10 on revenue of C$118.3 million, up 5.5% year over year. Revenue growth was driven by software, services, and international projects, but weaker gross margin and lower earnings led to an EPS miss versus the reported C$0.1433 consensus forecast.
About Evertz Technologies
Evertz Technologies Limited is a Canadian broadcast-technology company listed on the Toronto Stock Exchange under the ticker TSX: ET; its U.S. over-the-counter ticker is EVTZF. Founded in 1966 and headquartered in Burlington, Ontario, Evertz develops, manufactures, and markets video and audio infrastructure for broadcast, telecommunications, professional AV, government, military, enterprise, education, and new-media customers. Its portfolio spans software-defined video networking (SDVN), IP-based production systems, content routing, monitoring, cloud workflows, Ultra HD, HDR, and high-bandwidth, low-latency video environments.
The company generated record annual revenue of C$515.8 million in fiscal 2026, underscoring its scale in broadcast and media infrastructure. Its fiscal year ends April 30, so the reported quarter ended July 31, 2026, represents the first quarter of fiscal 2027. At quarter-end, Evertz had 75.7 million common shares outstanding, C$443.6 million in total assets, and C$194.7 million in shareholders’ equity.
Top Financial Highlights
- Total revenue increased 5.5% year over year to C$118.3 million, from C$112.1 million in Q1 fiscal 2026.
- Net earnings declined 33.1% to C$8.0 million, from C$11.9 million a year earlier.
- Fully diluted EPS fell to C$0.10, compared with C$0.15 in the prior-year quarter.
- Revenue came in below the reported EPS benchmark on profitability: diluted EPS of C$0.10 was below the C$0.1433 forecast cited in earnings coverage.
- Gross margin totaled C$69.3 million, up modestly from C$68.8 million in the prior-year period.
- Gross margin percentage fell to 58.6%, versus 61.4% in Q1 fiscal 2026, a decline of 280 basis points.
- Earnings from operations declined to C$11.0 million, from C$15.0 million a year earlier
- Software, services and other software revenue rose 14.1% to C$58.9 million, accounting for 49.8% of total quarterly revenue.
- Hardware revenue declined 1.9% to C$59.3 million, from C$60.5 million in the prior-year quarter.
- U.S. and Canada revenue increased 1% to C$79.9 million, compared with C$79.5 million a year earlier.
- International revenue rose 17.2% to C$38.3 million, driven particularly by project activity in Europe.
- Gross R&D spending increased 4.0% to C$38.5 million, reflecting higher salary and patent-related professional costs.
- Selling and administrative expense rose 4.9% to C$19.9 million, although it remained broadly stable as a percentage of revenue at 16.8%.
- Cash generated from operations was C$0.8 million, down from C$33.5 million, principally due to a C$20.1 million raw-material inventory build.
- Cash, net of bank indebtedness, was C$2.5 million at July 31, 2026, down from C$19.1 million at April 30, 2026.
- Working capital remained substantial at C$131.4 million.
- Purchase-order backlog exceeded C$259 million at the end of August 2026, up 9% sequentially, while August shipments totaled C$30 million.
- The board declared a quarterly dividend of C$0.205 per share, payable on or about October 1, 2026.
Beat or Miss?
| Metric | Reported | Difference/Analysis |
| Revenue | C$118.3 million | Revenue increased 5.5% YoY from C$112.1 million. No explicit revenue-consensus figure was available in the supplied earnings materials. |
| Diluted EPS | C$0.10 | Missed the reported forecast of C$0.1433 by about C$0.0433 per share, or roughly 30%. |
| Net earnings | C$8.0 million | Declined from C$11.9 million, as the lower gross-margin rate and higher operating costs outweighed revenue growth. |
| Gross margin | 58.60% | Fell from 61.4% a year earlier, a 280-basis-point contraction. |
| Software and services revenue | C$58.9 million | Rose 14% and represented nearly half of total sales, partially offsetting lower hardware revenue. |
| Purchase-order backlog | Over C$259 million | Up 9% sequentially as of August 31, signaling improved near-term order visibility. |
The earnings report was therefore mixed: Evertz delivered top-line growth and a stronger backlog, but EPS, net income, cash generation, and gross margin weakened. The key positive was the increasing software/services contribution and international project completion; the main investor concern was whether lower margins and working-capital intensity will persist.
What Leadership Is Saying
“Management is encouraged with the Company’s revenue outlook, including within the cloud native technology and service business.”
This outlook indicates that Evertz sees ongoing opportunity in cloud-native video, software and service delivery—areas that can support its transition from a predominantly hardware-oriented model toward a broader recurring and solutions-based revenue mix.
“Gross margin percentages may vary depending on the mix of products sold, the Company’s success in winning more complete projects, utilization of manufacturing capacity and the competitiveness of the pricing environment.”
CFO Doug Moore also described the quarter’s financial drivers on the earnings call, noting that gross margin remained within the company’s target range despite declining from the prior year. He linked the cash decline mainly to the proactive purchase of roughly C$20 million in raw materials—including memory, storage, and servers—to manage longer supply-chain lead times tied to AI demand.
Consolidated Financial Information
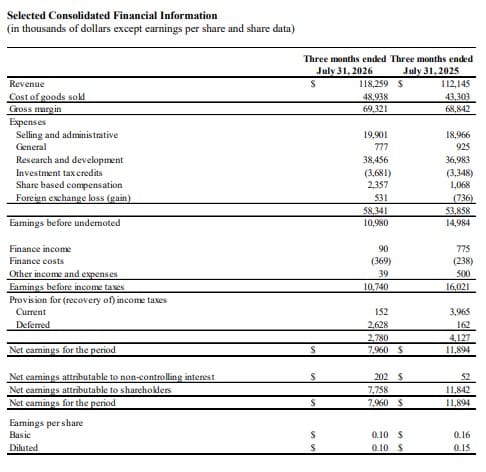
(Source: evertz.com)
- The table presents the company’s selected consolidated financial information for the three months ended July 31, 2026, compared with the same period in 2025, with figures reported in USD thousands except earnings per share.
- Revenue increased to USD 118.3 million in 2026 from USD 112.1 million in 2025, representing growth of about 5.5%. Cost of goods sold also increased to USD 48.9 million from USD 43.3 million, resulting in a relatively modest increase in gross margin to USD 69.3 million, compared with USD 68.8 million a year earlier.
- Total expenses rose to USD 58.3 million from USD 53.9 million. Research and development remained the largest expense category, increasing to USD 38.5 million, while selling and administrative expenses increased to USD 19.9 million. Share-based compensation also rose notably to USD 2.4 million from USD 1.1 million.
- As expenses grew faster than gross margin, earnings before other items declined to USD 11.0 million from USD 15.0 million. Earnings before income taxes fell to USD 10.7 million, compared with USD 16.0 million in the prior-year period.
- After income taxes, net earnings decreased to USD 8.0 million from USD 11.9 million, a decline of about 33%. Net earnings attributable to shareholders were USD 7.8 million, compared with USD 11.8 million in 2025.
- Earnings per share also weakened. Basic EPS declined to USD 0.10 from USD 0.16, while diluted EPS decreased to USD 0.10 from USD 0.15.
- Overall, the table shows that although the company achieved higher revenue in 2026, rising operating expenses and costs resulted in lower profitability and earnings compared with the same quarter in 2025
Historical Performance
| Category | Q1 Fiscal 2027 | Q1 Fiscal 2026 | Change (%) |
| Revenue | C$118.3 million | C$112.1 million | 5.50% |
| Gross profit | C$69.3 million | C$68.8 million | 0.70% |
| Gross margin | 58.60% | 61.40% | –280 bps |
| Operating expenses | C$58.3 million | C$53.9 million | 8.30% |
| Earnings from operations | C$11.0 million | C$15.0 million | –26.7% |
| Net earnings | C$8.0 million | C$11.9 million | –33.1% |
| Diluted EPS | C$0.10 | C$0.15 | –33.3% |
| Operating cash flow | C$0.8 million | C$33.5 million | –97.6% |
| U.S./Canada revenue | C$79.9 million | C$79.5 million | 0.60% |
| International revenue | C$38.3 million | C$32.7 million | 17.20% |
| Software/services revenue | C$58.9 million | C$51.6 million | 14.10% |
| Hardware revenue | C$59.3 million | C$60.5 million | –1.9% |
The financial trend shows that software, services, and international operations were the primary growth engines. However, total operating expenses increased faster than sales, while the gross-margin percentage contracted, resulting in a disproportionate decline in operating earnings and net income.
Competitor Comparison
A directly comparable peer table cannot be prepared on a like-for-like basis from Evertz’s release because competitors operate under different reporting currencies, fiscal calendars, business mixes, and segment disclosures. Evertz also does not provide an official peer-comparison table in its quarterly report.
| Category | Evertz Q1 Fiscal 2027 | Relevant Competitive Context | Analysis |
| Revenue | C$118.3 million | Broadcast and media-infrastructure competitors typically combine hardware, software, services, and cloud products | Evertz’s revenue mix is approaching parity between hardware and software/services, with software/services at 49.8% of sales. |
| Software/services revenue | C$58.9 million | Competition includes broadcast automation, cloud production, IP video, and media-workflow vendors | This revenue stream grew 14% YoY, faster than overall company sales, supporting Evertz’s strategic migration toward software-enabled solutions. |
| Hardware revenue | C$59.3 million | Hardware vendors face component, pricing, and project-timing pressures | Hardware revenue declined modestly, reflecting a softer quarter for equipment sales relative to software/services. |
| Gross margin | 58.60% | Margin performance is influenced by product mix, regional mix, and competitive pricing | The 280-basis-point YoY decline highlights that revenue growth did not fully translate into earnings growth. |
| Backlog | Over C$259 million | Backlog is an important indicator for project-led equipment and systems suppliers | The 9% sequential increase provides evidence of continued demand, with order intake described as broadly based and relatively hardware-heavy. |
How the Market Reacted?
The supplied release did not report a definitive closing-day stock-price reaction. However, a post-results market report dated September 17 stated that Evertz shares had fallen 13.2%, attributing the move to earnings weakness and a valuation reset after the quarterly results. The negative reaction is consistent with the reported EPS shortfall, lower net earnings, a gross-margin decline, and sharply weaker reported operating cash flow.
At the same time, the strong backlog, international revenue growth, and expansion in software and services provide offsets that investors may monitor in subsequent quarters.



