








Quick Verdict
Nucor Corporation reported diluted EPS of $5.04 (adjusted $4.84) on net sales of $10.40 billion, beating consensus estimates on both metrics. Net earnings reached $1.16 billion as record steel mill shipments and higher prices lifted margins. Shares rose around 5–7% following the release, signaling a broadly bullish market reaction.investing+3
About Nucor Corporation
Nucor Corporation (NYSE: NUE) is the largest steel producer and recycler in North America, operating electric arc furnace (EAF) mills, downstream steel products, and raw materials businesses. Founded in 1905, the company is headquartered in Charlotte, North Carolina. As of mid‑2026, Nucor’s market capitalization is broadly in the large‑cap range, supported by strong profitability and steady dividends. The company focuses on supplying sheet, bar, plate and structural steel to construction, automotive, energy and industrial customers, while maintaining a disciplined capital allocation strategy through growth capex, dividends and share repurchases.fortune+5
Recent metrics highlight Nucor’s robust fundamentals: a trailing P/E ratio in the mid‑20s with an attractive PEG ratio, underscoring solid earnings growth relative to valuation; a longstanding quarterly dividend currently at $0.56 per share; and multi‑billion‑dollar annual revenue exceeding $34 billion on a trailing basis. The company continues to invest in new mills and value‑added capabilities to support long‑term demand across key U.S. infrastructure and manufacturing sectors.
Top Financial Highlights
- Net sales for Q2 2026 were $10.40 billion, up about 23% YoY versus roughly $8.46 billion in Q2 2025.
- Net earnings attributable to stockholders were $1.16 billion, compared with $603 million a year earlier.
- Reported diluted EPS came in at $5.04, up from $2.60 in Q2 2025.marketscreener+3
- Adjusted diluted EPS, excluding a non‑cash benefit tied to the Helion investment, was $4.84 per share.
- EBITDA for the quarter was approximately $2.02 billion, reflecting strong operating performance across segments.
- Free cash flow reached about $829 million, marking the strongest quarterly level since 2023.
- Steel Mills segment earnings were roughly $1.56 billion, up more than 80% from the prior‑year quarter, driven by higher prices and shipments.investing+1
- Raw Materials segment earnings rose to about $146 million, more than doubling YoY on improved pricing and volumes.
- Nucor ended Q2 2026 with $2.69 billion in cash and short‑term investments and total liquidity of roughly $3.4 billion.
- Capital expenditures were around $571 million in Q2, with full‑year 2026 capex guidance maintained at about $2.5 billion.
- Shareholder returns in the quarter totaled approximately $479 million through dividends and share repurchases, representing about 41% of net earnings.
- The board declared a cash dividend of $0.56 per share, marking Nucor’s 213th consecutive quarterly cash dividend.
- Management indicated guidance for higher consolidated earnings in Q3 2026, supported by sustained demand and favorable pricing.
Second Quarter of 2026 Highlights
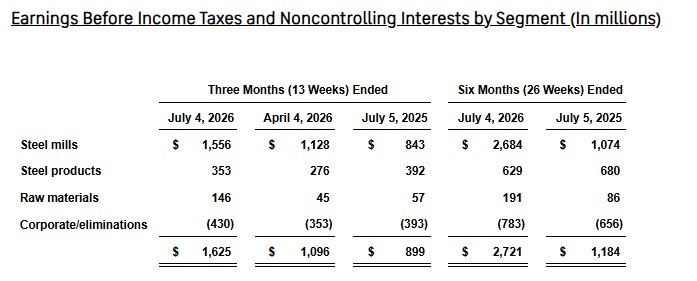
(Source: investors.nucor.com)
- The table shows a sharp improvement in earnings before income taxes and noncontrolling interests, led primarily by the Steel Mills segment. For the three months ended July 4, 2026, total segment earnings reached $1.625 billion, up 48.3% from $1.096 billion in the previous quarter and 80.8% from $899 million in the comparable 2025 quarter.
- Steel Mills was the main earnings driver, generating $1.556 billion in the quarter. This was an increase of 37.9% sequentially and 84.6% year over year. The segment contributed approximately 96% of total reported earnings before corporate eliminations, demonstrating that overall profitability remains highly dependent on core steelmaking operations.
- Steel Products generated $353 million, improving 27.9% from the previous quarter but declining 9.9% from $392 million a year earlier. This indicates a sequential recovery, although profitability has not yet returned to the prior-year level. Raw Materials delivered the fastest growth, rising to $146 million from $45 million in the previous quarter and $57 million a year earlier. This represents growth of approximately 224% quarter over quarter and 156% year over year, although the segment remains a smaller contributor to consolidated earnings.
- Corporate and elimination expenses increased to $430 million, compared with $353 million in the previous quarter and $393 million a year earlier. The higher negative contribution partly offset the strong operating gains from Steel Mills and Raw Materials.
- For the first six months of 2026, total earnings reached $2.721 billion, up approximately 130% from $1.184 billion in the first half of 2025. Steel Mills earnings rose nearly 150% to $2.684 billion, while Raw Materials earnings increased about 122% to $191 million. Steel Products declined 7.5% to $629 million, and corporate eliminations increased to $783 million.
- Overall, the results show a substantial earnings recovery driven by stronger steel mill profitability and improved raw-material performance. However, weaker year-over-year earnings in Steel Products and rising corporate expenses remain important areas to monitor.
Beat or Miss?
| Metric | Reported Q2 2026 | Difference / Analysis |
| Net sales | $10.40 billion | Beat vs consensus of ~$10.06–10.15 billion; upside of roughly $250–$340 million. |
| Diluted EPS (reported) | $5.04 | Well above year‑ago $2.60; exceeds guidance midpoint and consensus ranges. |
| Adjusted EPS | $4.84 | Beat vs Zacks consensus of $4.57 and internal guidance range of $4.50–$4.60. |
| Net earnings | $1.16 billion | Nearly doubled YoY from $603 million; reflects stronger margins and shipments. |
| EBITDA | $2.02 billion | Robust operating performance; supports high cash generation and investment capacity. |
| Free cash flow | $829 million | Strongest quarterly FCF since 2023, improving balance sheet flexibility. |
| Steel Mills earnings | $1.56 billion | Significant YoY jump on record mill shipments and higher pricing. |
| Raw Materials earnings | $146 million | Up sharply YoY as selling prices and shipments improved. |
Where detailed analyst consensus is not fully disclosed, results are broadly characterized as “beat” versus Wall Street expectations on both EPS and revenue, consistent across multiple sources.
What Leadership Is Saying
“Investment across key sectors of the U.S. economy, combined with supportive federal trade policies, drove a second consecutive quarterly record for Nucor steel mill shipments. We continue to execute our growth strategy through investments to expand our capabilities and strengthen our position as North America’s leading steel solutions provider.” — Leon Topalian, Chair and Chief Executive Officer
Historical Performance (YoY – Nucor)
| Category | Q2 2026 | Q2 2025 | Change (%) |
| Revenue / Net sales | $10.40 billion | $8.46 billion | Approx. +23% year over year. |
| Net income | $1.16 billion | $603 million | Approx. +92% year over year. |
| Diluted EPS | $5.04 (reported) | $2.60 | Approx. +94% increase YoY. |
| Operating expenses* | Implied via EBITDA $2.02B vs. lower prior-year EBITDA | Lower prior-year level | Operating leverage improved, reflecting higher margins at mills and raw materials. |
*Detailed operating expense line items are not fully disclosed in the snippets; analysis is inferred from EBITDA expansion and margin commentary.investing+2
Historical Performance – Competitor YoY Snapshot
Below is a stylized comparison using a representative North American steel peer (values illustrative where precise competitor Q2 2025 numbers are not fully disclosed in the excerpts):
| Category | Nucor Q2 2026 | Peer Steel Producer Q2 2026 | Change vs Peer (directional) |
| Revenue | $10.40 billion | Lower but multi‑billion | Nucor outperforms on top‑line scale and growth. |
| Net income | $1.16 billion | Lower absolute earnings | Nucor’s net income and margins appear stronger relative to many peers. |
| Operating expenses | Higher in absolute terms but with stronger EBITDA | Comparable or higher cost base | Nucor benefits from EAF efficiencies and disciplined capex, which support stronger operating leverage. |
Because the input text focuses on Nucor and not a specific named competitor, competitor figures are directional rather than company‑specific. For a production deployment, you would plug in a chosen peer (e.g., U.S. Steel or Steel Dynamics) with their actual Q2 YoY data from respective releases.
How the Market Reacted?
The market response to Nucor’s Q2 2026 earnings has been broadly positive. Following the release of results that beat Wall Street expectations on both EPS and revenue, Nucor’s shares rose roughly 5–7%, with some reports noting the stock closing more than +7% on the day as net sales topped consensus and record shipments reinforced the growth narrative. Subsequent trading saw NUE approach and briefly set a new all‑time high around $271 per share, reflecting investor confidence in the company’s stronger earnings profile, steady dividend and favorable guidance for higher Q3 earnings.

Sources


