Introduction
Garmin Statistics: Garmin is the company that, without making too much noise, continues to support your running, boating, and even the flying side of things. Known for its reliability and precision, the company has built a powerful reputation. Garmin spans fitness, aviation, marine, outdoor, and automotive markets. Its ability to blend advanced engineering with user-focused design has fueled consistent growth. This blend has solidified its leadership in smart devices. With a forward-thinking approach, Garmin keeps expanding its reach through inventive products and strong financial performance.
During the years 2024 – 2025, the company once again broke records. They achieved billions in sales and double-digit growth in most product lines. The large profits enabled it to declare dividends and acquire other companies. This article will present the recent Gramin statistics.
Editor’s Choice
- The Garmin Outdoor segment saw the biggest share with 31% of total revenue and 44% of operating income, followed by Fitness with 28% of revenue and 30% of operating income.
- Aviation brought in 14% of revenue and 13% of operating income, while Marine represented 17% of revenue and 15% of operating income.
- The Auto OEM segment constituted 10% of revenue but incurred a minor operating loss (- 2%).
- During the years 2019-2024, Garmin investors obtained a cumulative return of 139%, which was better than the S&P 500 (97%) and the S&P 500 Consumer Discretionary Index (94%).
- A US$100 investment in Garmin back in 2019 would have been worth US$239 at the end of 2024, signalling a strong long-term value creation.
- Net sales in 2024 jumped 20% to 18.6 million units over the previous year, which was made possible by all major categories’ growth, with fitness wearables and outdoor devices being the top two categories.
- Gross profit rose by 23% in 2024 along with a 120-basis-point increase in gross margin. Fitness, outdoor, and marine saw their margins go up considerably because of lower production costs and a more favourable product mix.
- The average rate of return on cash and investments went from 2.7% in 2023 to 3.3% in 2024, thereby increasing interest income.
- A US$20.6 million foreign currency loss was recorded by Garmin in 2024 as a result of the U.S. Dollar gaining strength against key currencies like the Euro, Polish Zloty, and Australian Dollar.
- Operating cash flow for the year 2024 was US$1,432.5 million, which is an increase compared to the US$1,376.3 million in 2023, and the reason for this was higher sales.
- The company’s total amount of inventories reached US$1,473.98 million in 2024, which is an increase from US$1,345.96 million in 2023, and this can be attributed to the growth in raw materials, work-in-process, and finished goods.
- The total amount recognised as cumulative currency translation adjustments was US$(116.9) million in 2024, which is indicative of the foreign exchange fluctuations resulting from various functional currencies.
Garmin Revenue And Operating Income By Segment
(Source: garmin.com)
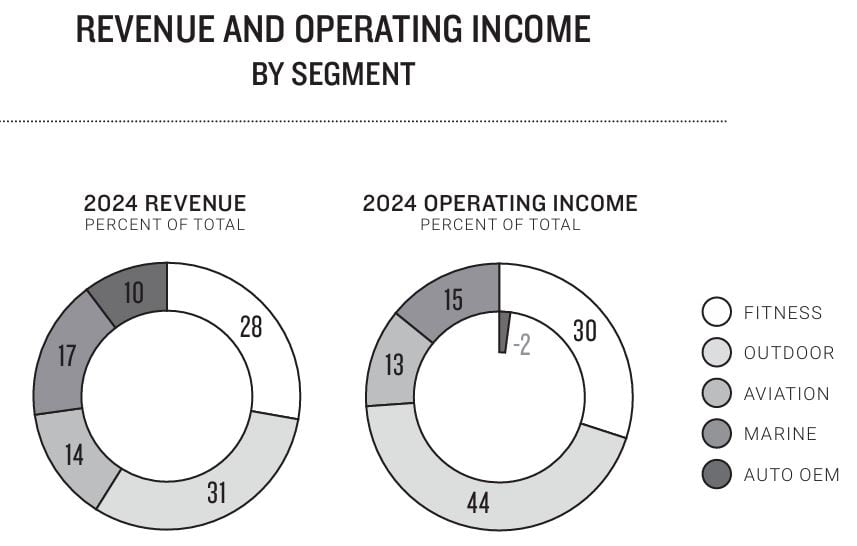
- Revenue of Garmin in 2024 wholly came from five primary business sectors, and each of these sectors took a different percentage from the company’s overall performance.
- The Outdoor segment was the top one among others, and its share was 31% of the total revenue; also, this segment was the most profitable, generating 44% of the operating income.
- The sales of outdoor watches, adventure gear, and navigation devices, which have high profit margins, are the main forces behind this growth.
- Next in line was the Fitness segment, which accounted for 28% of total revenues and was responsible for 30% of total operating income.
- The company’s fitness devices—e.g., smartwatches and sports trackers—were still strong in the market, thanks to the growing health and activity monitoring trend among consumers.
- The share of the Aviation segment was 14% of the revenue and 13% of the operating income, signifying that the business remains stable and profitable.
- The Marine segment took 17% of the total revenue, and the operating profit was 15%, indicating that the business was doing well, and it was mainly due to the strong sales of chartplotters, sonar, and marine communication systems.
- In the end, the Auto OEM division accounted for 10% of the overall revenue but was responsible for -2% of the total operating income, indicating that it was running at a slight loss.
- This sector is gradually maturing, and Garmin is still investing in high-quality automotive technologies and integrated systems for major car brands.
Garmin Cumulative Return
(Source: garmin.com)
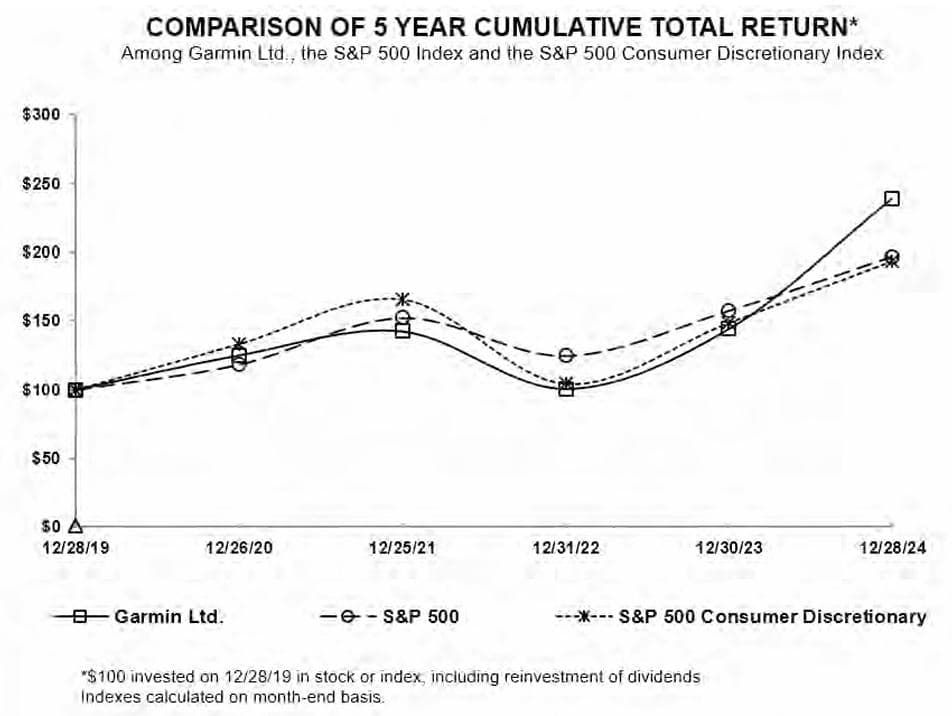
- Between December 2019 and December 2024, Garmin Ltd. provided a significantly more favourable total shareholder return than both the S&P 500 Index and the S&P 500 Consumer Discretionary Index.
- The evaluation is based on a hypothetical US$100 investment at the end of 2019, assuming that all dividends were reinvested.
- Initially, the three investments are all equivalent at US$100. At the end of 2020, the value of Garmin increased to US$125.14, while the S&P 500 reached US$118.40, and the Consumer Discretionary Index was slightly higher at US$133.30.
- The following year, Garmin was still on the rise and reached US$142.59 by the end of 2021, while the S&P 500 had climbed to US$152.39 and the Consumer Discretionary Index to US$165.87.
- In 2022, markets went down across the board, and Garmin’s cumulative return fell to US$100.81, almost reverting to its 2019 level, which mirrored the general decline in stocks.
- The S&P 500 and Consumer Discretionary Index also decreased to US$124.79 and US$104.45, respectively.
- In 2023, Garmin’s performance underwent a drastic rebound, and its value grew to US$144.25, which was better than both of the indices — the S&P 500 at US$157.59 and the Consumer Discretionary Index at US$148.74.
- The most significant increment came in 2024, where the cumulative return of Garmin skyrocketed to US$239.0; thus, an investor’s US$100 would have almost US$239 after five years. The same period also saw the S&P 500 reaching US$197.02, and the Consumer Discretionary Index touching US$193.57.
- The information presented here indicates that not only did Garmin manage to recover after the 2022 crisis at a very strong rate, but it also thoroughly beat the whole market iindexby the end of 2024.
- 139% cumulative return over five years was given to Garmin shareholders, versus a 97% return of the S&P 500 Index and a 94% return of the Consumer Discretionary Index.
- The comparison above, in fact, reveals the company’s resilience along with its strong profitability and investor trust during the different market phases.
Garmin Net Sales
(Source: garmin.com)
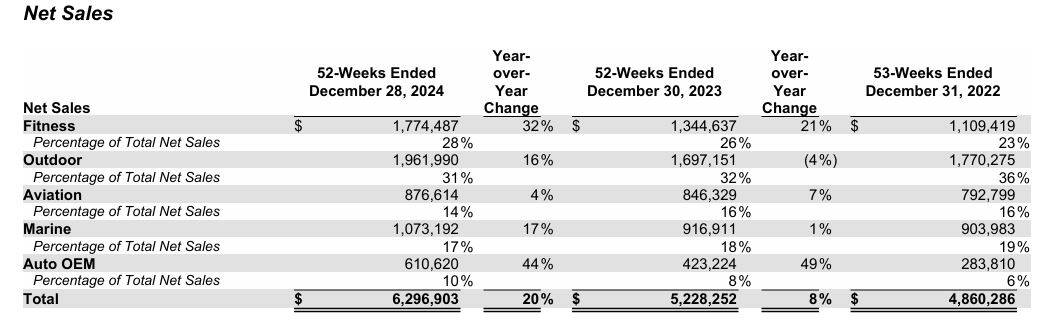
- In the fiscal year 2024, net sales increased by 20% year-over-year, thus reflecting a robust overall growth.
- The total number of sold units went up approximately 15% and amounted to 18.6 million units, compared to 16.2 million in 2023.
- Sales generated by outdoor products were still the largest contributors to the overall revenue, and they accounted for 31% of the total revenue, just a bit lower than the 32% of the previous year.
- Fitness revenue increased in all categories, with the wearable segment being the major contributor to the rise.
- The outdoor segment revenue got a hike because of the high demand for adventure watches, and aviation revenue growth was attributed to increased OEM sales.
- The marine segment revenue climbed due to the acquisition of JL Audio, and the auto OEM revenue was up because of larger shipment volumes of domain controllers.
Garmin Gross Profit
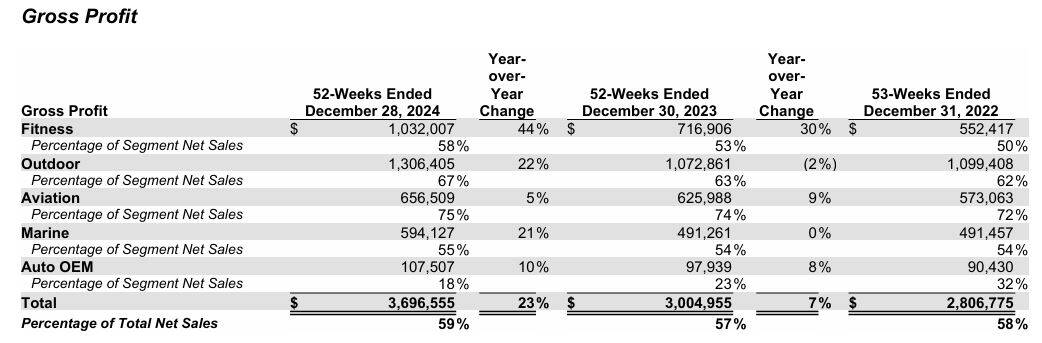
(Source: garmin.com)
- In the financial year 2024, there was a massive 23% rise in gross profit that was attributed to higher sales income than in the prior year as the main reason.
- There was also a 120 basis points increase in the overall gross margin, which was due to the great profitability of some business areas, although this was to a certain extent counter-balanced by the poor segment mix.
- The fitness, outdoor, and marine divisions were the ones to have excellent margins that improved greatly—by 480, 340, and 180 basis points, respectively—and this was mainly due to the combination of reduced production costs and switching to the more profitable product mixes.
- The aviation segment was a bit more or less the same in terms of margin, but the auto OEM segment had a very big decline of 550 basis points, the majority of which was attributed to the less favourable product mix.
Garmin Interest Income Impact On Financial Performance
- The company increased its average interest rate on cash and investments to 3.3% for the fiscal year 2024 from 2.7% in 2023.
- This rise in interest income was mainly due to higher cash and investment balances and better returns on fixed-income securities.
- The gains and losses from foreign currencies were determined by the fluctuations in exchange rates against the U.S. Dollar.
- The company has major functional currencies—the Taiwan Dollar, Euro, and U.S. Dollar—and is also subject to minor currencies such as British Pound, Australian Dollar, and Polish Zloty, apart from operating in several countries.
- A loss of US$20.6 million from foreign currency was realised by the company in 2024; this was primarily as a result of the U.S. Dollar’s gaining strength against the Euro, Polish Zloty, and Australian Dollar.
- These events had their corresponding losses of US$27.1 million, US$11.3 million, and US$8.7 million, respectively.
- Nevertheless, the losses were partially compensated for by a US$36.4 million gain coming from the strengthening of the U.S. Dollar by 6.5% against the Taiwan Dollar.
- The overall impact of other minor currencies resulted in a net loss of US$9.9 million.
- Conversely, the fiscal year 2023 experienced a foreign currency gain of US$26.4 million.
- This was chiefly the result of the U.S. dollar losing its value by 12.3% against the Polish zloty and 3.1% against the euro, creating gains of US$24.4 million and US$8.8 million, respectively.
- A US$5.1 million loss from fluctuations against the Taiwan Dollar was another factor that reduced the gain, and there were also minor losses totalling US$1.7 million from other currencies.
Garmin Cash Flows
- In the fiscal year of 2024, the company produced a total of US$1,432.5 million in cash as a result of its operating activities, which is a slight increase from the cash amount of US$1,376.3 million in the previous year, 2023.
- The primary cause for the increase was the higher cash inflow from customers resulting from the increase in net sales, although it was partly offset by higher payments for the cost of goods sold and operating expenses.
- Cash for investing activities increased to US$393.3 million in 2024 from US$333.0 million in 2023.
- The increase was almost entirely due to the company’s changed strategy of purchasing more in 2024 from the previous 2023 of redeeming the securities, thus resulting in the greater net purchases of marketable securities.
- Nevertheless, this was partly countered by the acquisition cash outflow being lower than in the previous year.
- The cash for financing activities saw an outflow of US$626.9 million in 2024, while it was slightly higher at US$636.5 million in 2023.
- The reason for the decline was mainly the reduction in treasury shares purchases under the share repurchase program, but this was countered to some extent by increased dividend payments and purchases of treasury stock in connection with the equity awards.
Garmin Inventories
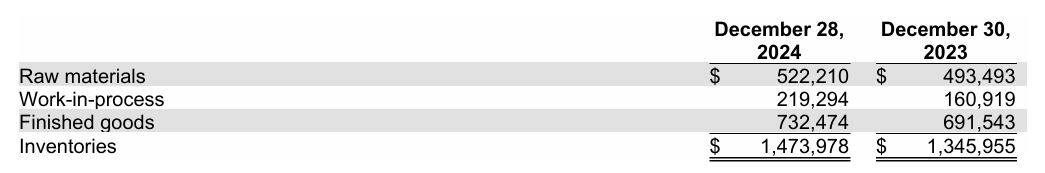
(Source: garmin.com)
- Garmin values its inventory at the lower of cost or net realisable value and applies the FIFO method to determine the cost. This cost comprises materials, labour, and manufacturing overhead related to purchases and production.
- The company, furthermore, makes inventory adjustments for possible obsolescence or unmarketable items based on future demand and market conditions estimates.
- Garmin’s total inventory on December 28, 2024, was US$1.47 billion, which is US$128 million more than it was in 2023, US$1.35 billion.
- The inventory comprised raw materials, work-in-process, and finished goods of US$522.21 million, US$219.29 million, and US$732.47 million, respectively, among which the increases compared to the previous year US$493.49 million, US$160.92 million, and US$691.54 million for finished goods, respectively.
Foreign Currency Translation And Exchange Impact
- Garmin Ltd. has foreign subsidiaries that transact in currencies other than the U.S. Dollar (USD).
- The financial statements of these subsidiaries are translated into USD for consolidation in accordance with ASC Topic 830, Foreign Currency Matters. Sales, costs, and expenses are translated using the average exchange rates for the year, while assets and liabilities are translated using the exchange rates at year-end.
- The overall impact of this translation is reflected in stockholders’ equity as part of accumulated other comprehensive income (loss), which amounted to a loss of US$(116.9) million in 2024 and US$(11.5) million in 2023.
- Foreign currency transactions are recorded at the exchange rates in effect on the transaction date, and the assets and liabilities are subsequently revalued as of the balance sheet date.
- The primary source of foreign currency gains and losses for the company is cash, receivables, and payables owed or due in the company’s non-operational foreign currencies.
- Garmin’s report reflects a loss in foreign currency dealings of US$20.6 million for the year 2024, as opposed to a profit of US$26.4 million in 2023 and a US$11.3 million loss in 2022.
- The exchange rate movements of the U.S. Dollar against currencies such as the Euro, Polish Zloty, Australian Dollar, and Taiwan Dollar became the main reason for these fluctuations.
- Garmin Corporation, located in Taiwan, abides by the Taiwan Foreign Exchange Control Statute, which governs foreign currency transactions.
- Although there are almost no restrictions on trade-related exchanges, non-trade transactions surpassing US$50 million annually must be sanctioned by the Central Bank of the Republic of China (Taiwan).
Conclusion
Garmin Statistics: The 2024-2025 performance of Garmin indicates the company is a technology leader that is well diversified. It has new and/or returning customers. It can grow and earn consistently in all segments. The segment of Outdoor and Fitness is the one where the company sees most of its sales and profits. In contrast, the Aviation and Marine segments are responsible for the very stability that the company has.
Besides the volatility in foreign exchange markets and trouble within the Auto OEM segment, Garmin has managed to stay financially solvent through good inventory management. They provide decent returns to their shareholders. The company’s 139% cumulative five-year return is a sign of investor trust. It is also a sign of the company’s ability to persevere. In summary, Garmin’s even-handed approach to business and nurturing of innovation has made it a strong candidate for enduring victories. These victories are expected in the long run.
