









Quick Verdict
New Hope Corporation reported FY2026 net profit after tax of A$161.0 million, or roughly 19.1 Australian cents per share based on 842.7 million shares implied by its interim dividend disclosures. Revenue was A$1.767 billion, down 0.5%. Shares rose about 3.5% to A$6.50 following the result, aided by a 30-cent final dividend.
About New Hope Corporation
New Hope Corporation Limited (ASX: NHC) is an Australian thermal-coal producer founded in 1952 and headquartered in Brisbane, Queensland. The company operates the 80%-owned Bengalla Mine in New South Wales and the New Acland Mine in southeast Queensland, while also owning Queensland Bulk Handling (QBH), a coal export terminal with 12 million tonnes per annum capacity. Its coal is principally marketed to Asian power-generation customers, alongside smaller interests in exploration, agricultural operations, oil and gas, and strategic coal investments.
At the time of the FY2026 announcement, NHC traded at approximately A$6.51 per share, implying a market capitalization of around A$5.49 billion. The stock’s trailing P/E ratio was 36.06x, while the indicated forward dividend yield was 3.18% before incorporating the newly announced final dividend. New Hope reported approximately 1,575 full-time employees. FY2026 results demonstrate resilient volumes and cash generation, but materially lower earnings as realised coal prices declined and depreciation increased.
Top Financial Highlights
- Total FY2026 revenue was A$1.767 billion, marginally down 0.5% year on year as higher sales volumes largely offset weaker realised coal prices.
- Net profit after tax (NPAT) was A$161.0 million, down 63.4% from A$439.4 million in FY2025.
- Underlying EBITDA reached A$514.3 million, declining about 33% year on year.
- Operating cash flow remained robust at A$564.1 million for FY2026.
- Available cash was A$778.5 million at 31 July 2026, comprising A$484.8 million of cash and cash equivalents plus A$293.7 million of fixed-income investments.
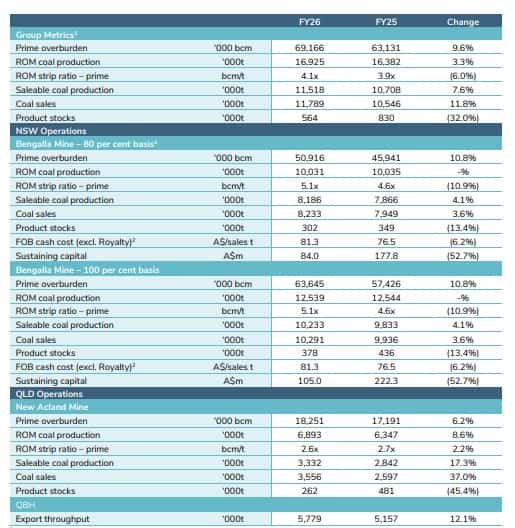
- Total ROM coal production rose 3.3% to 16.925 million tonnes.
- Saleable coal production increased 7.6% to 11.518 million tonnes, above the top of the company’s 10.2–11.5 Mt guidance range.
- Coal sales grew 11.8% to 11.789 million tonnes, also above guidance.
- Bengalla Mine coal sales were 8.233 million tonnes, up 3.6% year on year; saleable production increased 4.1% to 8.186 million tonnes.
- New Acland Mine coal sales climbed 37.0% to 3.556 million tonnes, with saleable production rising 17.3% to 3.332 million tonnes.
- QBH export throughput grew 12.1% to 5.779 million tonnes, supported by the New Acland ramp-up.
- Group realised pricing fell 9% to A$143.2 per tonne for FY2026, reflecting a softer thermal-coal pricing environment.
- Bengalla’s FY2026 FOB cash cost, excluding royalties, was A$81.3 per sales tonne, at the low end of its A$81–A$89 guidance range.
- Depreciation and amortisation increased to about A$238.7 million, versus A$191 million in FY2025, contributing to the sharper decline in bottom-line profit.
- The board declared a fully franked final dividend of 30.0 cents per share, taking total FY2026 ordinary dividends to 40.0 cents per share.
Beat or Miss?
| Metric | Reported | Difference/Analysis |
| Revenue | A$1.767 billion | Down 0.5% year on year; increased coal volumes nearly compensated for weaker realised pricing. |
| Net profit after tax | A$161.0 million | Down 63.4% from A$439.4 million in FY2025; Reuters characterized the result as New Hope’s smallest annual profit since 2021. |
| Underlying EBITDA | A$514.3 million | Down about 33% year on year, driven primarily by lower coal pricing despite stronger production. |
| Coal sales | 11.789 Mt | Exceeded the high end of company guidance of 10.2–11.5 Mt. |
| Saleable coal production | 11.518 Mt | Marginally exceeded the high end of company guidance of 10.2–11.5 Mt. |
| Bengalla FOB cash cost | A$81.3/t | At the low end of A$81–A$89/t company guidance, indicating continued cost discipline. |
| Consensus revenue estimate | N/A | No comparable analyst consensus revenue estimate was available in the reviewed primary and market-summary materials. |
| Consensus EPS estimate | N/A | No consensus EPS benchmark was identified in the reviewed materials. |
Consolidated Production Metrics
(Source: newhopegroup.com.au)
Exploring Other Perspectives
(Source: simplywall.st)
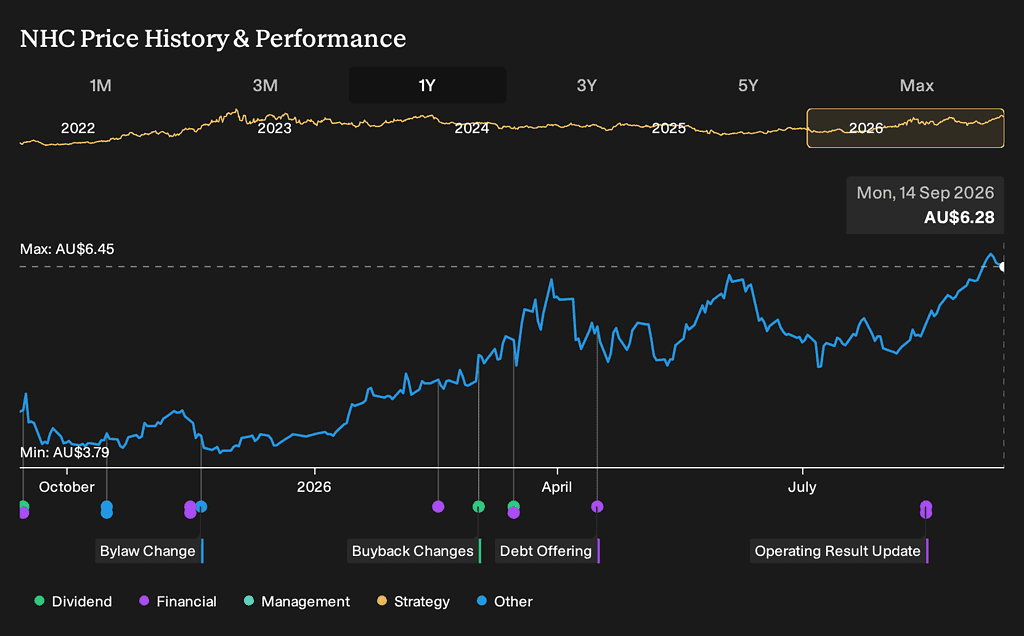
- The chart presents NHC’s 1-year share price history and performance, showing a clear overall upward trend despite periods of volatility.
- The share price recorded a minimum of AU$3.79 during the period and later recovered strongly. Momentum improved through early 2026, followed by noticeable price fluctuations from March to July. After a temporary decline during mid-2026, the stock resumed its upward movement and approached its yearly high toward September.
- NHC reached a maximum price of AU$6.45, while the share price stood at AU$6.28 on 14 September 2026, placing it close to the highest level recorded during the period.
- The chart also highlights several corporate events that may have influenced investor sentiment, including Bylaw Change, Buyback Changes, Debt Offering, and Operating Result Update, along with dividend, financial, management, strategy, and other announcements.
- Overall, NHC’s share price performance indicates a strong recovery from its yearly low, with positive momentum toward the end of the period.
What Leadership Is Saying
“Solid full year operating performance.”
— New Hope’s FY2026 results headline, reflecting production and sales volumes that exceeded the upper end of company guidance.
“This result in an inflationary cost environment demonstrates the operation’s disciplined cost management, consistent operating performance and ability to absorb higher-than-usual waste movement while maintaining cost outcomes within guidance.”
— Management commentary on Bengalla Mine’s FY2026 FOB cash cost performance.
Historical Performance
| Category | FY2026 | FY2025 | Change (%) |
| Revenue | A$1.767 billion | Approximately A$1.776 billion | -0.50% |
| Net profit after tax | A$161.0 million | A$439.4 million | -63.40% |
| Underlying EBITDA | A$514.3 million | Approximately A$767.6 million | -33.00% |
| Operating cash flow | A$564.1 million | Not disclosed in the reviewed FY2026 result excerpts | N/A |
| Saleable coal production | 11.518 Mt | 10.708 Mt | 7.60% |
| Coal sales | 11.789 Mt | 10.546 Mt | 11.80% |
| Group realised price | A$143.2/t | A$157.1/t | -8.80% |
Competitor Comparison
A direct FY2026 earnings comparison with Whitehaven Coal and Yancoal Australia is not appropriate in this announcement-led article because their financial years, reporting dates, accounting conventions, asset mixes, and latest reported periods may differ. The most defensible comparison available from the current market-data snapshot is scale and valuation context.
| Category | New Hope (ASX: NHC) | Whitehaven Coal (ASX: WHC) | Yancoal Australia (ASX: YAL) |
| Market capitalization | A$5.489 billion | A$6.887 billion | A$8.180 billion |
| Share price snapshot | A$6.51 | A$8.38 | A$6.20 |
| Intraday move on snapshot date | 3.58% | -0.53% | 0.73% |
| Core industry classification | Thermal coal | Thermal coal | Thermal coal |
| Latest FY2026 NHC revenue | A$1.767 billion | N/A in reviewed sources | N/A in reviewed sources |
| Latest FY2026 NHC NPAT | A$161.0 million | N/A in reviewed sources | N/A in reviewed sources |
New Hope sits below both Whitehaven and Yancoal by the cited market-cap snapshot, although it has differentiated exposure through its Bengalla stake, New Acland expansion, and integrated QBH port infrastructure. Comparable peer income-statement figures should be aligned by reporting period before calculating year-on-year differences.
How the Market Reacted?
Shares in New Hope rose approximately 3.5% to A$6.50 immediately after the FY2026 release, trading near the stock’s 52-week high of A$6.54. The response suggests investors placed more weight on the fully franked 30-cent final dividend, the company’s strong cash position, and higher coal volumes than on the large year-on-year decline in NPAT. On the market-data snapshot, NHC was quoted at A$6.51, up A$0.22, or 3.58%, with its year-to-date return at 63.72%



