









Quick Verdict
CNB Financial Corporation reported first-quarter 2026 diluted EPS of $0.88, exceeding the FactSet estimate of $0.80, while total revenue of $83.3 million fell short of the $84.7 million consensus estimate. The release contained no specific after-hours movement; contemporaneous market data showed shares up 0.89%.
About CNB Financial Corporation
CNB Financial Corporation (NASDAQ: CCNE) is a Clearfield, Pennsylvania-based financial holding company founded in 1865. It operates principally through CNB Bank, a full-service regional bank serving individual, commercial, governmental, and institutional clients across Pennsylvania, Ohio, New York, and Virginia. Its offerings span deposits, commercial and consumer lending, private banking, treasury management, trust, wealth management, card services, and merchant solutions.
At the end of Q1 2026, CNB reported approximately $8.5 billion in consolidated assets and operated 79 offices through CNB Bank and its ERIEBANK, FCBank, BankOnBuffalo, Ridge View Bank, ESSA Bank, and Impressia Bank brands. The company’s scale increased materially following its 2025 acquisition of ESSA Bancorp, which added loans, deposits, branches, goodwill, and customer relationships.
For context, more recent market data in late August/September 2026 placed CCNE’s market capitalization near $1.0 billion, trailing P/E at roughly 10.8x–11.1x, and forward dividend yield near 2.2%. Those figures are current-market reference points rather than metrics available on the April 20 earnings-release date.
Top Financial Highlights
- Total revenue—net interest income plus non-interest income—was $83.3 million, up from $56.9 million in Q1 2025 but below $86.4 million in Q4 2025.
- Net income available to common shareholders reached $26.0 million, versus $10.4 million a year earlier and $32.6 million in Q4 2025.
- Diluted EPS was $0.88, up from $0.50 in Q1 2025 and above the $0.80 FactSet consensus estimate.
- Reported net income was $27.04 million, compared with $11.48 million in the prior-year quarter.
- Net interest income increased to $73.3 million from $48.4 million in Q1 2025, aided by the ESSA acquisition and higher year-over-year loan balances.
- Non-interest income totaled $10.0 million, rising from $8.5 million a year earlier but declining from $12.1 million in Q4 2025.
- Net interest margin was 3.83%, compared with 3.38% in Q1 2025 and 3.84% in Q4 2025.
- Non-interest expense was $49.2 million, compared with $41.0 million a year earlier; the increase primarily reflected costs acquired through the ESSA transaction.
- The efficiency ratio improved to 59.03%, from 72.07% in Q1 2025, signaling stronger operating leverage despite a larger cost base.
- Pre-provision net revenue was $34.1 million, up from $15.9 million in the prior-year period.
- Loans were $6.4 billion, excluding $78.3 million of syndicated balances. Organic loans declined $67.3 million sequentially, principally due to early commercial real-estate payoffs.
- Deposits were $7.1 billion; including deposits held for sale, organic deposits increased $115.0 million sequentially.
- Cash equivalents held at the Federal Reserve were $517.7 million, while total contingent liquidity resources were $6.2 billion.
- Total shareholders’ equity was $889.1 million, up 1.95% from Q4 2025 and 42.37% year over year.
Banking “segments” and major income streams
CNB does not report conventional operating segments with separate revenue disclosure in the Q1 release. The most meaningful revenue breakdown is therefore by banking income stream:
| Revenue stream | Q1 2026 | Q1 2025 | Year-over-year change |
|---|---|---|---|
| Net interest income | $73.3 million | $48.4 million | +51.4% |
| Non-interest income | $10.0 million | $8.5 million | +17.6% |
| Total revenue | $83.3 million | $56.9 million | +46.4% |
CNB’s primary operating brands included CNB Bank, ERIEBANK, FCBank, BankOnBuffalo, Ridge View Bank, ESSA Bank, and Impressia Bank; the company did not provide quarterly revenue by each brand.
Non-Interest Expense
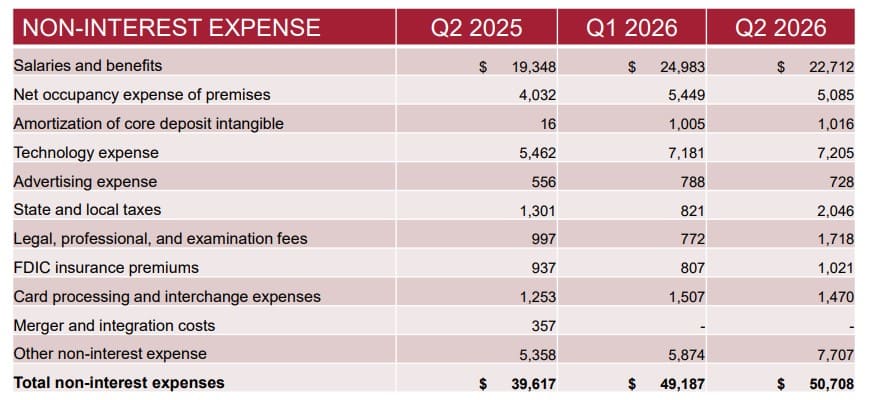
(Source: cnbbank.q4ir.com)
- The table shows that total non-interest expenses increased from $39,617 in Q2 2025 to $49,187 in Q1 2026 and further to $50,708 in Q2 2026, indicating a continued rise in operating costs.
- Salaries and benefits remained the largest expense category, rising from $19,348 in Q2 2025 to $24,983 in Q1 2026, before declining to $22,712 in Q2 2026. Technology expense also remained significant, increasing from $5,462 to $7,181 and then to $7,205. Other non-interest expense showed consistent growth, reaching $7,707 in Q2 2026, compared with $5,358 in Q2 2025.
- Several categories recorded notable increases in Q2 2026. State and local taxes rose to $2,046, while legal, professional, and examination fees increased to $1,718. FDIC insurance premiums also increased to $1,021. Meanwhile, net occupancy expense of premises declined slightly from $5,449 in Q1 2026 to $5,085 in Q2 2026, and advertising expense decreased from $788 to $728.
- Overall, the table indicates that higher technology, regulatory, professional, and other operating expenses contributed to the increase in total non-interest expenses during Q2 2026.
Beat or Miss?
| Metric | Reported | Difference/Analysis |
| Diluted EPS | $0.88 | Beat FactSet consensus of $0.80 by $0.08, or 10.0%. |
| Total revenue | $83.3 million | Missed FactSet consensus of $84.7 million by $1.4 million, or about 1.7%. |
| Net interest income | $73.3 million | Up from $48.4 million in Q1 2025; no standalone consensus figure identified in the cited earnings coverage. |
| Net income available to common shareholders | $26.0 million | Up from $10.4 million in Q1 2025; no consensus estimate disclosed. |
| Net interest margin | 3.83% | Nearly flat sequentially versus 3.84% in Q4 2025; above 3.38% in Q1 2025. |
The mixed outcome stemmed from an earnings beat despite a modest revenue shortfall. Higher profitability reflected a substantially larger post-ESSA franchise, a lower efficiency ratio, and year-over-year growth in net interest income. However, sequential revenue softened as large CRE payoffs lowered average loan balances and purchase-accounting accretion declined.
What Leadership Is Saying
CNB’s April 20 release includes extensive commentary from President and CEO Michael Peduzzi, but does not provide a separate CFO quote. To avoid misattributing a statement, the second quotation below is also CEO commentary focused on financial performance.
“In a quarter without significant merger-related expenses from our ESSA Bancorp acquisition and related system conversion in 2025, these first quarter earnings reflect positive and sustained core results, including expected operating efficiencies.” — Michael Peduzzi, President & CEO
“The continued success and growth of our Treasury Management efforts, reflected by a continuing increase in our noninterest-bearing deposit balances, allowed us to continue to fund our franchise operations primarily by deposits as opposed to higher-costing borrowings.” — Michael Peduzzi, President & CEO
Historical Performance
| Category | Q1 2026 | Q1 2025 | Change (%) |
| Total revenue | $83.3 million | $56.9 million | 46.40% |
| Net income available to common shareholders | $26.0 million | $10.4 million | 150.00% |
| Total net income | $27.0 million | $11.5 million | 135.50% |
| Net interest income | $73.3 million | $48.4 million | 51.40% |
| Non-interest income | $10.0 million | $8.5 million | 17.60% |
| Non-interest expense | $49.2 million | $41.0 million | 20.00% |
| Diluted EPS | $0.88 | $0.50 | 76.00% |
| Net interest margin | 3.83% | 3.38% | +45 basis points |
The year-over-year comparison is affected materially by CNB’s acquisition of ESSA Bancorp in 2025. For a more normalized comparison, management said adjusted Q1 2025 earnings excluding merger-related costs were $11.9 million, or $0.57 per diluted share. Against that adjusted base, Q1 2026 EPS increased 54.39%.
Competitor Comparison
A direct peer-company Q1 2026 comparison cannot be reliably constructed from CNB’s press release because it does not identify a defined peer group or provide competitor financial data. The more defensible comparison is CNB’s own regional-bank operating performance before and after the ESSA transaction.
| Category | Q1 2026 | Q1 2025 | Change (%) |
| CNB total assets | Approximately $8.5 billion | Not separately stated in the release’s overview | N/A |
| CNB total deposits | $7.1 billion | Comparable reported figure not presented in the release summary | N/A |
| CNB loans, excluding syndicated balances | $6.4 billion | Comparable reported figure not presented in the release summary | N/A |
| CNB efficiency ratio | 59.03% | 72.07% | Improved by 13.04 percentage points |
| CNB return on average equity | 12.36% | 7.52% | Improved by 4.84 percentage points |
| CNB return on average tangible common equity | 14.89% | 8.15% | Improved by 6.74 percentage points |
For a current peer benchmark, market coverage later placed CCNE’s forward P/E near 9.7x versus a cited peer median of 11.8x as of mid-July 2026. This is a valuation comparison, not a like-for-like Q1 revenue, income, or expense comparison.
How the Market Reacted?
The earnings release itself did not state a same-day or after-hours share-price reaction. Contemporary market coverage showed CCNE trading at $30.49 and up 0.89% on April 23, 2026, while the April 20 results showed an EPS beat but a revenue miss.
Overall report sentiment was moderately constructive: profitability, capital, deposits, liquidity, and efficiency improved, while lower sequential loans and revenue reflected early CRE loan repayments rather than disclosed credit losses. CNB said the $40 million office-loan payoff and more than $70 million of ESSA-related CRE reductions were full repayments with no concessions or loan losses.



